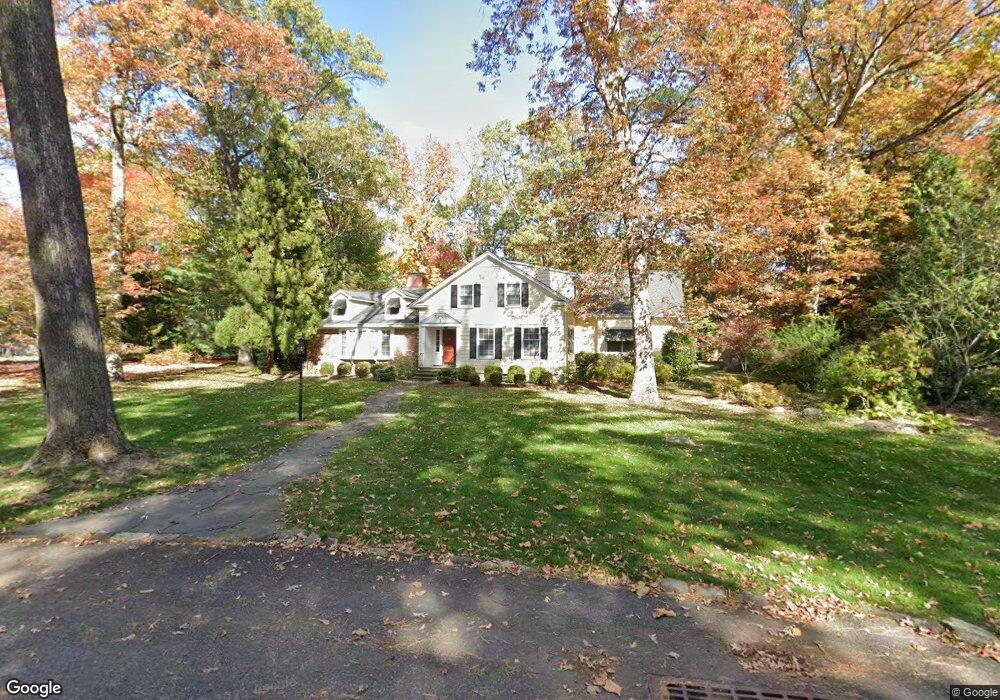
3 Hickory Ln Roseland, NJ 07068
Estimated Value: $1,308,000 - $1,701,000
Studio
--
Bath
4,022
Sq Ft
$382/Sq Ft
Est. Value
About This Home
This home is located at 3 Hickory Ln, Roseland, NJ 07068 and is currently estimated at $1,536,789, approximately $382 per square foot. 3 Hickory Ln is a home located in Essex County with nearby schools including Lester C. Noecker Elementary School, West Essex Middle School, and West Essex High School.
Ownership History
Date
Name
Owned For
Owner Type
Purchase Details
Closed on
Jun 7, 2002
Sold by
Mochary Patricia Meglio
Bought by
Crandall Terance and Crandall Elizabeth
Current Estimated Value
Home Financials for this Owner
Home Financials are based on the most recent Mortgage that was taken out on this home.
Original Mortgage
$350,000
Outstanding Balance
$147,988
Interest Rate
6.81%
Estimated Equity
$1,388,801
Purchase Details
Closed on
Jul 28, 1997
Sold by
Culver Harry
Bought by
Mochary Stephen and Mochary Patricia
Home Financials for this Owner
Home Financials are based on the most recent Mortgage that was taken out on this home.
Original Mortgage
$300,000
Interest Rate
7.31%
Create a Home Valuation Report for This Property
The Home Valuation Report is an in-depth analysis detailing your home's value as well as a comparison with similar homes in the area
Home Values in the Area
Average Home Value in this Area
Purchase History
| Date | Buyer | Sale Price | Title Company |
|---|---|---|---|
| Crandall Terance | $950,000 | -- | |
| Mochary Stephen | $385,000 | -- |
Source: Public Records
Mortgage History
| Date | Status | Borrower | Loan Amount |
|---|---|---|---|
| Open | Crandall Terance | $350,000 | |
| Previous Owner | Mochary Stephen | $300,000 |
Source: Public Records
Tax History
| Year | Tax Paid | Tax Assessment Tax Assessment Total Assessment is a certain percentage of the fair market value that is determined by local assessors to be the total taxable value of land and additions on the property. | Land | Improvement |
|---|---|---|---|---|
| 2025 | $17,397 | $997,600 | $544,700 | $452,900 |
| 2024 | $17,397 | $997,600 | $544,700 | $452,900 |
Source: Public Records
Map
Nearby Homes
- 91 Eagle Rock Ave
- 2 Canoe Ln
- 6 Browning Ct
- 9 Beechtree Ln
- 5 Beechtree Ln
- 27-29 Roseland Ave
- 15 Godfrey Ave
- 356 Fells Rd
- 131 Rensselaer Rd
- 194 Eagle Rock Ave
- 331 Roseland Ave
- 319 Roseland Ave
- 69 Lapis Cir Unit 253
- 34 Lincoln St
- 27 Edgemont Rd
- 3 Rutgers Ct
- 11 Fowler Dr
- 83 Devon Rd
- 20 Fowler Dr
- 4 Hilltop Way
Your Personal Tour Guide
Ask me questions while you tour the home.