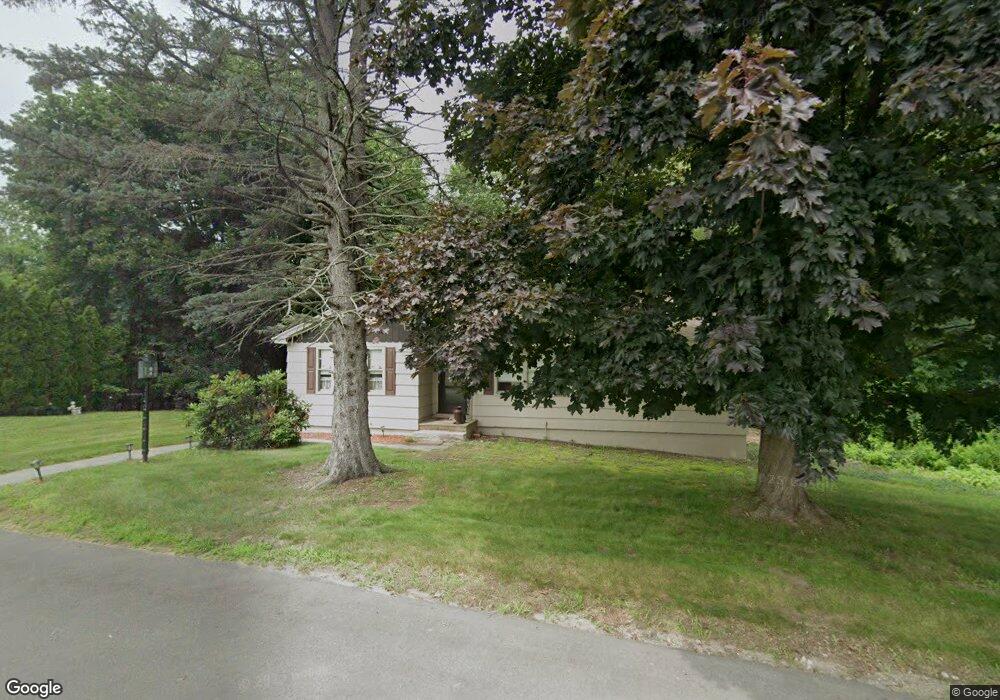
3 Hilbert Terrace Methuen, MA 01844
The East End NeighborhoodEstimated Value: $542,217 - $620,000
3
Beds
1
Bath
1,932
Sq Ft
$297/Sq Ft
Est. Value
About This Home
This home is located at 3 Hilbert Terrace, Methuen, MA 01844 and is currently estimated at $574,554, approximately $297 per square foot. 3 Hilbert Terrace is a home located in Essex County with nearby schools including Timony Grammar School, Methuen High School, and Notre Dame Cristo Rey High School.
Ownership History
Date
Name
Owned For
Owner Type
Purchase Details
Closed on
Apr 25, 2018
Sold by
Shamberger Keith T and Shamberger Nancy M
Bought by
Shamberger Nancy M and Shamberger Keith T
Current Estimated Value
Purchase Details
Closed on
Jan 1, 1976
Bought by
Shamberger Keith
Create a Home Valuation Report for This Property
The Home Valuation Report is an in-depth analysis detailing your home's value as well as a comparison with similar homes in the area
Home Values in the Area
Average Home Value in this Area
Purchase History
| Date | Buyer | Sale Price | Title Company |
|---|---|---|---|
| Shamberger Nancy M | -- | -- | |
| Shamberger Nancy M | -- | -- | |
| Shamberger Nancy M | -- | -- | |
| Shamberger Keith | -- | -- |
Source: Public Records
Mortgage History
| Date | Status | Borrower | Loan Amount |
|---|---|---|---|
| Previous Owner | Shamberger Keith | $81,000 | |
| Previous Owner | Shamberger Keith | $71,523 | |
| Previous Owner | Shamberger Keith | $10,000 |
Source: Public Records
Tax History
| Year | Tax Paid | Tax Assessment Tax Assessment Total Assessment is a certain percentage of the fair market value that is determined by local assessors to be the total taxable value of land and additions on the property. | Land | Improvement |
|---|---|---|---|---|
| 2025 | $4,656 | $440,100 | $201,300 | $238,800 |
| 2024 | $4,587 | $422,400 | $183,600 | $238,800 |
| 2023 | $4,337 | $370,700 | $163,200 | $207,500 |
| 2022 | $4,149 | $317,900 | $136,000 | $181,900 |
| 2021 | $3,884 | $294,500 | $129,200 | $165,300 |
| 2020 | $3,872 | $288,100 | $129,200 | $158,900 |
| 2019 | $3,606 | $254,100 | $115,600 | $138,500 |
| 2018 | $3,519 | $246,600 | $115,600 | $131,000 |
| 2017 | $3,406 | $232,500 | $115,600 | $116,900 |
| 2016 | $3,248 | $219,300 | $108,800 | $110,500 |
| 2015 | $3,146 | $215,500 | $108,800 | $106,700 |
Source: Public Records
Map
Nearby Homes
- 37 Albion St
- 65 Arthur St
- 593 Prospect St
- 173 Jackson St
- 68 Ashford St
- 12 Annette St
- 25-27 Bicknell Ave
- 611 Prospect St
- 14 Court St
- 7 Erhardt Terrace
- 18 Erhardt Terrace
- 39 Swan Ave
- 396 Oak St
- 687 Jackson St
- 30 Anderson Dr
- 106 Leroy Ave
- 32 Josephine Ave
- 97 Kenwood Rd
- 264 E Haverhill St Unit 2
- 128 Pleasant Valley St
Your Personal Tour Guide
Ask me questions while you tour the home.