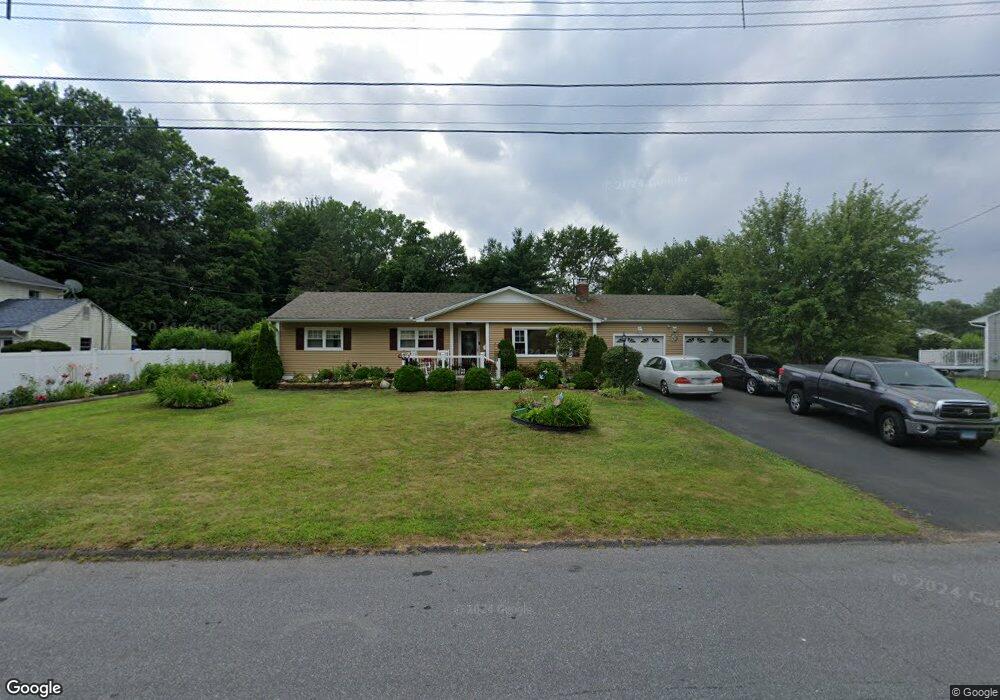
3 Hilltop Cir Bloomfield, CT 06002
Estimated Value: $413,000 - $441,000
3
Beds
3
Baths
1,634
Sq Ft
$259/Sq Ft
Est. Value
About This Home
This home is located at 3 Hilltop Cir, Bloomfield, CT 06002 and is currently estimated at $422,430, approximately $258 per square foot. 3 Hilltop Cir is a home located in Hartford County with nearby schools including Laurel School, Carmen Arace Intermediate School, and Metacomet School.
Ownership History
Date
Name
Owned For
Owner Type
Purchase Details
Closed on
Jul 22, 2005
Sold by
Justin Velda and Justin Felix
Bought by
Clunie Clive and Clunie Margaret
Current Estimated Value
Home Financials for this Owner
Home Financials are based on the most recent Mortgage that was taken out on this home.
Original Mortgage
$206,400
Outstanding Balance
$114,527
Interest Rate
6.75%
Mortgage Type
Purchase Money Mortgage
Estimated Equity
$307,903
Purchase Details
Closed on
Nov 22, 1999
Sold by
Forrest Charles and Forrest Patricia
Bought by
Fontenelle Velda
Home Financials for this Owner
Home Financials are based on the most recent Mortgage that was taken out on this home.
Original Mortgage
$134,550
Interest Rate
2.08%
Mortgage Type
Purchase Money Mortgage
Purchase Details
Closed on
Jan 12, 1987
Sold by
Litchfield Sheryl
Bought by
Forrest Charles
Create a Home Valuation Report for This Property
The Home Valuation Report is an in-depth analysis detailing your home's value as well as a comparison with similar homes in the area
Home Values in the Area
Average Home Value in this Area
Purchase History
| Date | Buyer | Sale Price | Title Company |
|---|---|---|---|
| Clunie Clive | $253,000 | -- | |
| Clunie Clive | $253,000 | -- | |
| Fontenelle Velda | $138,000 | -- | |
| Fontenelle Velda | $138,000 | -- | |
| Forrest Charles | $146,500 | -- |
Source: Public Records
Mortgage History
| Date | Status | Borrower | Loan Amount |
|---|---|---|---|
| Open | Forrest Charles | $206,400 | |
| Closed | Forrest Charles | $206,400 | |
| Previous Owner | Forrest Charles | $134,550 |
Source: Public Records
Tax History Compared to Growth
Tax History
| Year | Tax Paid | Tax Assessment Tax Assessment Total Assessment is a certain percentage of the fair market value that is determined by local assessors to be the total taxable value of land and additions on the property. | Land | Improvement |
|---|---|---|---|---|
| 2025 | $9,550 | $254,660 | $52,640 | $202,020 |
| 2024 | $6,732 | $171,570 | $39,690 | $131,880 |
| 2023 | $6,611 | $171,570 | $39,690 | $131,880 |
| 2022 | $6,182 | $171,570 | $39,690 | $131,880 |
| 2021 | $6,218 | $168,840 | $39,690 | $129,150 |
| 2020 | $6,122 | $168,840 | $39,690 | $129,150 |
| 2019 | $6,481 | $167,650 | $39,690 | $127,960 |
| 2018 | $5,680 | $147,070 | $38,920 | $108,150 |
| 2017 | $5,671 | $147,070 | $38,920 | $108,150 |
| 2016 | $5,537 | $147,070 | $38,920 | $108,150 |
| 2015 | $5,434 | $147,070 | $38,920 | $108,150 |
| 2014 | $6,072 | $169,890 | $51,240 | $118,650 |
Source: Public Records
Map
Nearby Homes
- 28 Carpenter Ln
- 11 Woodland Ave Unit E
- 2 Lee Cir
- 12 Filley St
- 14 Filley St
- 108 Woodland Ave
- 23 Hawthorne Ln Unit 23
- 4 Skinner Dr
- 25 Filley St
- 70 Tunxis Ave
- 79 Prospect St
- 40 Mountain Ave
- 18 Nolan Dr
- 86 Gabb Rd
- 208 Castlewood Dr Unit 208
- 12 Garrison Terrace
- 76 Silo Way Unit 76
- 234 Woodland Ave
- 256 Park Ave
- 159 School St
- 5 Hilltop Cir
- 30 Hill Farm Rd
- 28 Hill Farm Rd
- 1 Hilltop Cir
- 7 Hilltop Cir
- 4 Hilltop Cir
- 29 Hill Farm Rd
- 22 Hill Farm Rd
- 36 Hill Farm Rd
- 6 Hilltop Cir
- 8 Hilltop Cir
- 20 Hill Farm Rd
- 24 Hill Farm Rd
- 12 Latimer Ln
- 14 Latimer Ln
- 33 Hill Farm Rd
- 31 Hill Farm Rd
- 10 Latimer Ln
- 18 Hill Farm Rd
- 37 Hill Farm Rd