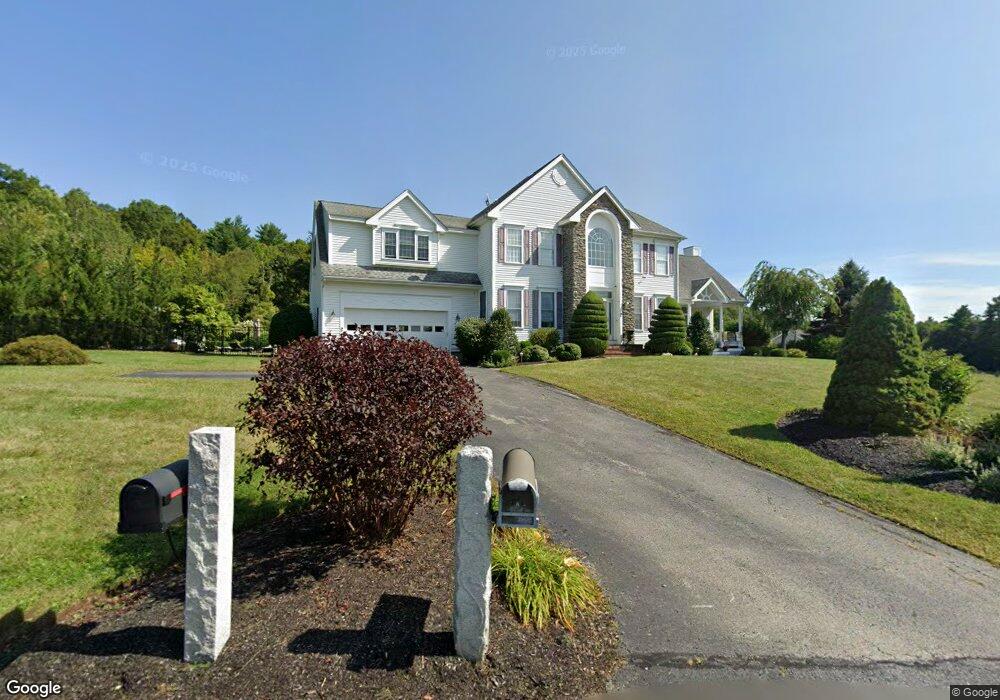
3 Julia Ln Pepperell, MA 01463
Estimated Value: $840,000 - $953,000
4
Beds
4
Baths
2,919
Sq Ft
$306/Sq Ft
Est. Value
About This Home
This home is located at 3 Julia Ln, Pepperell, MA 01463 and is currently estimated at $893,384, approximately $306 per square foot. 3 Julia Ln is a home located in Middlesex County with nearby schools including North Middlesex Regional High School, Pepperell Christian Academy, and Maple Dene & Moppet School.
Ownership History
Date
Name
Owned For
Owner Type
Purchase Details
Closed on
Jun 7, 2010
Sold by
Barresi Joseph
Bought by
Carlino Anthony and Carlino Loren
Current Estimated Value
Home Financials for this Owner
Home Financials are based on the most recent Mortgage that was taken out on this home.
Original Mortgage
$369,000
Outstanding Balance
$243,020
Interest Rate
4.62%
Mortgage Type
FHA
Estimated Equity
$650,365
Purchase Details
Closed on
Feb 9, 2009
Sold by
Barresi Margarita
Bought by
Barresi Joseph
Purchase Details
Closed on
Aug 26, 2005
Sold by
Robert M Hicks Inc
Bought by
Barresi Joseph and Barresi Margarita
Home Financials for this Owner
Home Financials are based on the most recent Mortgage that was taken out on this home.
Original Mortgage
$140,000
Interest Rate
5.68%
Mortgage Type
Purchase Money Mortgage
Create a Home Valuation Report for This Property
The Home Valuation Report is an in-depth analysis detailing your home's value as well as a comparison with similar homes in the area
Home Values in the Area
Average Home Value in this Area
Purchase History
| Date | Buyer | Sale Price | Title Company |
|---|---|---|---|
| Carlino Anthony | $469,000 | -- | |
| Barresi Joseph | -- | -- | |
| Barresi Joseph | $600,147 | -- |
Source: Public Records
Mortgage History
| Date | Status | Borrower | Loan Amount |
|---|---|---|---|
| Open | Carlino Anthony | $369,000 | |
| Previous Owner | Barresi Joseph | $140,000 |
Source: Public Records
Tax History
| Year | Tax Paid | Tax Assessment Tax Assessment Total Assessment is a certain percentage of the fair market value that is determined by local assessors to be the total taxable value of land and additions on the property. | Land | Improvement |
|---|---|---|---|---|
| 2025 | $11,533 | $788,300 | $232,500 | $555,800 |
| 2024 | $10,589 | $737,900 | $212,500 | $525,400 |
| 2023 | $10,409 | $687,500 | $192,500 | $495,000 |
| 2022 | $10,233 | $596,700 | $152,400 | $444,300 |
| 2021 | $9,836 | $548,900 | $128,400 | $420,500 |
| 2020 | $9,402 | $553,700 | $128,400 | $425,300 |
| 2019 | $5,024 | $509,200 | $128,400 | $380,800 |
| 2018 | $8,025 | $489,600 | $128,400 | $361,200 |
| 2017 | $7,628 | $478,700 | $120,400 | $358,300 |
| 2016 | $7,176 | $434,100 | $120,400 | $313,700 |
| 2015 | $6,924 | $434,100 | $120,400 | $313,700 |
| 2014 | $6,845 | $431,600 | $124,400 | $307,200 |
Source: Public Records
Map
Nearby Homes
- 8 Casie Ln
- 27 Merrimac Dr
- 14 Brookline St
- 39 Hollis St Unit A
- 147 Nashua Rd
- 28-30 Groton St
- 38 Tarbell St Unit 5B
- 38 Tarbell St Unit 1D
- 29 Tarbell St
- 11 Unkety Brook Way
- 113-115 Main St
- 12 Unkety Brook Way
- 4 Southgate Rd
- 77 Birchwood Dr
- 38 River Rd Unit 11
- 114 Groton St
- 13 Birch Dr
- 208 North St
- 194 Dow Rd
- 179 Wyman Rd
Your Personal Tour Guide
Ask me questions while you tour the home.