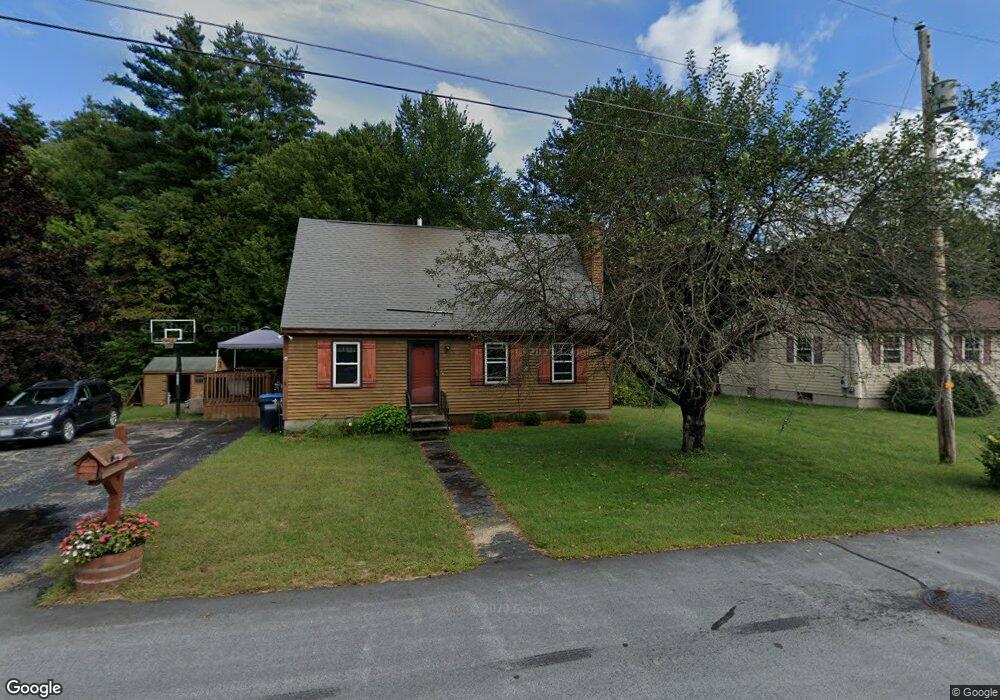
3 Kimberly Ln Allenstown, NH 03275
Estimated Value: $423,000 - $477,000
3
Beds
2
Baths
1,922
Sq Ft
$235/Sq Ft
Est. Value
About This Home
This home is located at 3 Kimberly Ln, Allenstown, NH 03275 and is currently estimated at $450,921, approximately $234 per square foot. 3 Kimberly Ln is a home located in Merrimack County with nearby schools including Allenstown Elementary School, Armand R. Dupont School, and Tender Years Child Care & Learning Center.
Ownership History
Date
Name
Owned For
Owner Type
Purchase Details
Closed on
Apr 23, 2010
Sold by
Hills Robert D and Hills Jeanne L
Bought by
Gagne Steve M and Gagne Heather J
Current Estimated Value
Home Financials for this Owner
Home Financials are based on the most recent Mortgage that was taken out on this home.
Original Mortgage
$199,224
Outstanding Balance
$132,690
Interest Rate
5%
Mortgage Type
Purchase Money Mortgage
Estimated Equity
$318,231
Create a Home Valuation Report for This Property
The Home Valuation Report is an in-depth analysis detailing your home's value as well as a comparison with similar homes in the area
Home Values in the Area
Average Home Value in this Area
Purchase History
| Date | Buyer | Sale Price | Title Company |
|---|---|---|---|
| Gagne Steve M | $202,900 | -- |
Source: Public Records
Mortgage History
| Date | Status | Borrower | Loan Amount |
|---|---|---|---|
| Open | Gagne Steve M | $199,224 |
Source: Public Records
Tax History Compared to Growth
Tax History
| Year | Tax Paid | Tax Assessment Tax Assessment Total Assessment is a certain percentage of the fair market value that is determined by local assessors to be the total taxable value of land and additions on the property. | Land | Improvement |
|---|---|---|---|---|
| 2024 | $9,217 | $362,600 | $145,200 | $217,400 |
| 2023 | $7,717 | $364,000 | $145,200 | $218,800 |
| 2022 | $7,098 | $364,000 | $145,200 | $218,800 |
| 2021 | $6,234 | $197,900 | $82,600 | $115,300 |
| 2020 | $5,798 | $197,900 | $82,600 | $115,300 |
| 2019 | $6,155 | $197,900 | $82,600 | $115,300 |
| 2018 | $5,967 | $197,900 | $82,600 | $115,300 |
| 2017 | $6,355 | $197,900 | $82,600 | $115,300 |
| 2016 | $5,695 | $168,200 | $60,100 | $108,100 |
| 2015 | $5,417 | $165,000 | $57,100 | $107,900 |
| 2014 | $5,574 | $165,000 | $57,100 | $107,900 |
| 2013 | $5,202 | $165,000 | $57,100 | $107,900 |
Source: Public Records
Map
Nearby Homes
- 19 Sullivan Dr
- 1 1/2 Bartlett St
- 10 Lane Dr
- 2 Cheryl Dr
- 111 Glass St
- 422 Dawn Dr Unit 23
- 427 Dawn Dr Unit 15
- 15 Sullivan Dr
- 12-14 Church St Unit 12,14
- 100 Main St Unit M10
- 100 Main St Unit 204
- 307 Dearborn Rd
- 4 Rodger Rd
- 7 Ferry St
- 15 Main St
- 233 Pembroke St
- 9 Pine Acres Rd
- 259 Pembroke St
- 1821 Hooksett Rd
- 101 4th Range Rd Unit 4