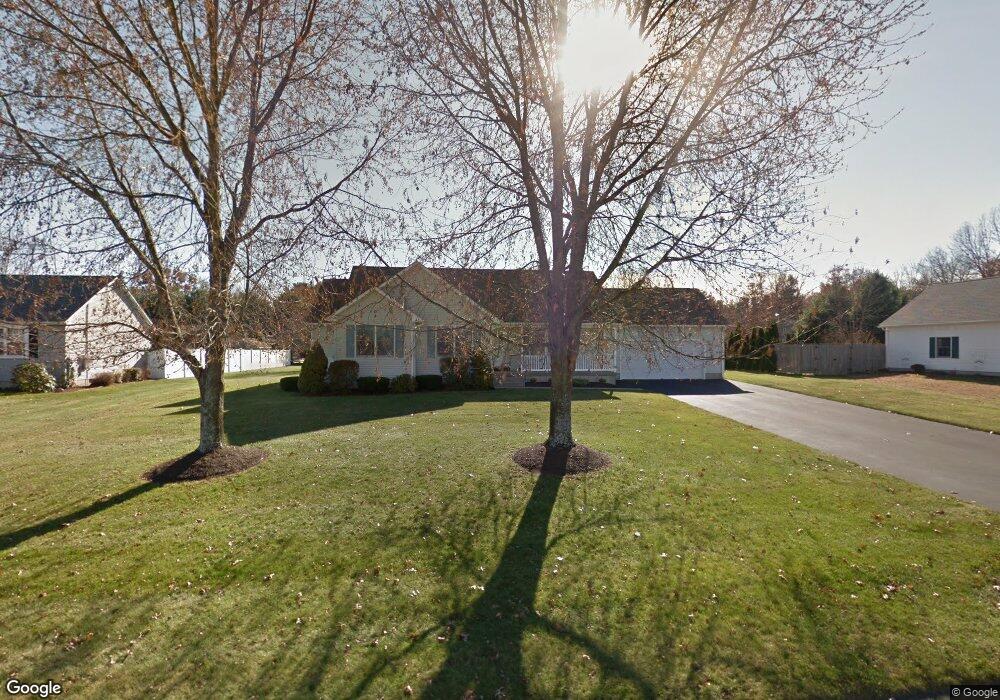
3 Laurel Dr Easthampton, MA 01027
Estimated Value: $477,000 - $534,000
3
Beds
3
Baths
1,452
Sq Ft
$346/Sq Ft
Est. Value
About This Home
This home is located at 3 Laurel Dr, Easthampton, MA 01027 and is currently estimated at $502,488, approximately $346 per square foot. 3 Laurel Dr is a home located in Hampshire County with nearby schools including Easthampton High School, Calvary Baptist Christian School, and Tri-County Schools.
Ownership History
Date
Name
Owned For
Owner Type
Purchase Details
Closed on
Aug 30, 2002
Sold by
Ligon Scott and Sherrill-Ligon Laura A
Bought by
Stgeorges June A and Stgeorges Paul F
Current Estimated Value
Home Financials for this Owner
Home Financials are based on the most recent Mortgage that was taken out on this home.
Original Mortgage
$160,000
Outstanding Balance
$68,347
Interest Rate
6.55%
Mortgage Type
Purchase Money Mortgage
Estimated Equity
$434,141
Purchase Details
Closed on
Sep 24, 1996
Sold by
Gawle Matthew B
Bought by
Ligon Scott and Sherrill Laura A
Home Financials for this Owner
Home Financials are based on the most recent Mortgage that was taken out on this home.
Original Mortgage
$130,000
Interest Rate
7.89%
Mortgage Type
Purchase Money Mortgage
Create a Home Valuation Report for This Property
The Home Valuation Report is an in-depth analysis detailing your home's value as well as a comparison with similar homes in the area
Home Values in the Area
Average Home Value in this Area
Purchase History
| Date | Buyer | Sale Price | Title Company |
|---|---|---|---|
| Stgeorges June A | $200,000 | -- | |
| Ligon Scott | $136,900 | -- |
Source: Public Records
Mortgage History
| Date | Status | Borrower | Loan Amount |
|---|---|---|---|
| Open | Ligon Scott | $50,000 | |
| Open | Ligon Scott | $160,000 | |
| Previous Owner | Ligon Scott | $130,000 |
Source: Public Records
Tax History
| Year | Tax Paid | Tax Assessment Tax Assessment Total Assessment is a certain percentage of the fair market value that is determined by local assessors to be the total taxable value of land and additions on the property. | Land | Improvement |
|---|---|---|---|---|
| 2025 | $6,182 | $452,200 | $136,000 | $316,200 |
| 2024 | $6,133 | $452,300 | $132,000 | $320,300 |
| 2023 | $4,774 | $325,900 | $104,200 | $221,700 |
| 2022 | $5,387 | $325,900 | $104,200 | $221,700 |
| 2021 | $5,913 | $337,100 | $104,200 | $232,900 |
| 2020 | $5,788 | $325,900 | $104,200 | $221,700 |
| 2019 | $5,099 | $329,800 | $121,500 | $208,300 |
| 2018 | $4,885 | $305,300 | $114,900 | $190,400 |
| 2017 | $4,764 | $293,900 | $110,200 | $183,700 |
| 2016 | $4,582 | $293,900 | $110,200 | $183,700 |
| 2015 | $4,453 | $293,900 | $110,200 | $183,700 |
Source: Public Records
Map
Nearby Homes
- 4 Laurel Dr
- 36 & 36R Holly Cir
- 29 Sandra Rd
- 245 Park St
- 1 Plain St
- 2 W Park Dr
- 36 Line St
- 95 Gunn Rd
- 6 S St & Abutting Lots
- 41 South St Unit 11
- 48 Gunn Rd
- 38 College Hwy
- 7 Western View Rd
- 385 Main St
- 19 Mount Tom Ave Unit 19
- M143 &152 Glendale St
- 19 Nicols Way Unit 19
- 2 Oak St
- 33 Knipfer Ave
- 12 Golden Cir
Your Personal Tour Guide
Ask me questions while you tour the home.