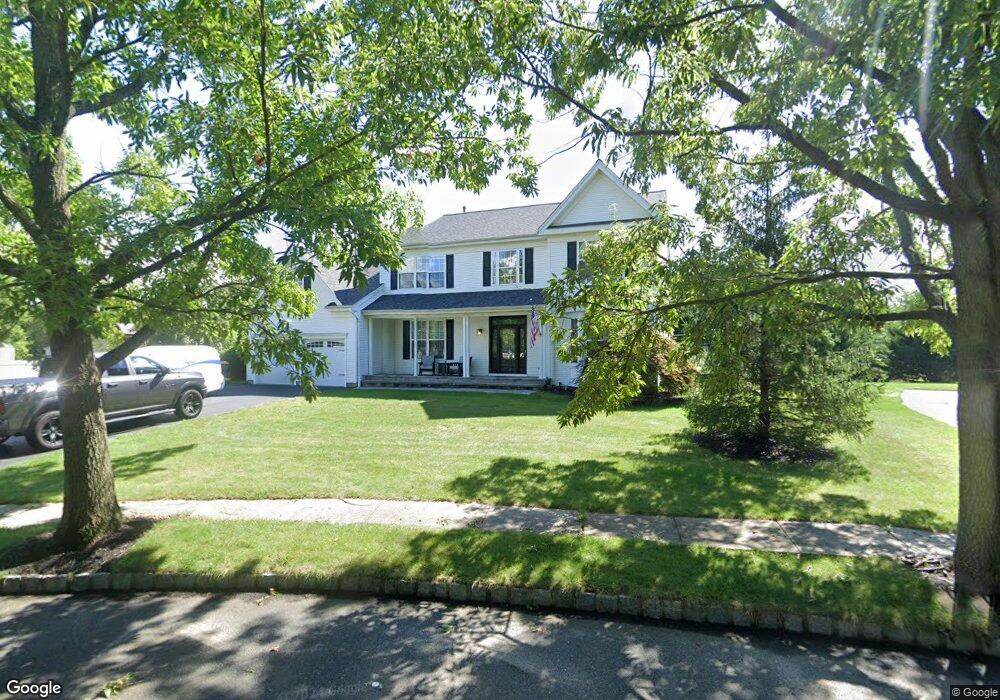
3 Liberty Ct Allentown, NJ 08501
Estimated Value: $1,053,000 - $1,108,000
4
Beds
2
Baths
3,390
Sq Ft
$317/Sq Ft
Est. Value
About This Home
This home is located at 3 Liberty Ct, Allentown, NJ 08501 and is currently estimated at $1,075,904, approximately $317 per square foot. 3 Liberty Ct is a home located in Monmouth County with nearby schools including Newell Elementary School, Stonebridge Middle School, and Allentown High School.
Ownership History
Date
Name
Owned For
Owner Type
Purchase Details
Closed on
Jun 11, 2021
Sold by
Hogan Patricia M and Hogan Patrick N
Bought by
Hogan Patrick N
Current Estimated Value
Home Financials for this Owner
Home Financials are based on the most recent Mortgage that was taken out on this home.
Interest Rate
2.96%
Purchase Details
Closed on
Apr 27, 2021
Sold by
Hogan Patrick N and Hogan Patricia M
Bought by
Hogan Patrick N
Home Financials for this Owner
Home Financials are based on the most recent Mortgage that was taken out on this home.
Interest Rate
2.96%
Purchase Details
Closed on
Mar 29, 2001
Sold by
Hovnanian K
Bought by
Hogan Patrick and Hogan Patricia
Home Financials for this Owner
Home Financials are based on the most recent Mortgage that was taken out on this home.
Original Mortgage
$370,200
Interest Rate
7.05%
Create a Home Valuation Report for This Property
The Home Valuation Report is an in-depth analysis detailing your home's value as well as a comparison with similar homes in the area
Home Values in the Area
Average Home Value in this Area
Purchase History
| Date | Buyer | Sale Price | Title Company |
|---|---|---|---|
| Hogan Patrick N | -- | -- | |
| Hogan Patrick N | -- | Allstates Title Service Inc | |
| Hogan Patrick N | -- | Allstate Title | |
| Hogan Patrick | $412,848 | -- |
Source: Public Records
Mortgage History
| Date | Status | Borrower | Loan Amount |
|---|---|---|---|
| Closed | Hogan Patrick N | -- | |
| Open | Hogan Patrick N | $450,000 | |
| Closed | Hogan Patrick N | $450,000 | |
| Previous Owner | Hogan Patrick | $370,200 |
Source: Public Records
Tax History Compared to Growth
Tax History
| Year | Tax Paid | Tax Assessment Tax Assessment Total Assessment is a certain percentage of the fair market value that is determined by local assessors to be the total taxable value of land and additions on the property. | Land | Improvement |
|---|---|---|---|---|
| 2025 | $18,345 | $1,077,500 | $505,100 | $572,400 |
| 2024 | $16,249 | $850,900 | $219,900 | $631,000 |
| 2023 | $16,249 | $731,600 | $225,800 | $505,800 |
| 2022 | $14,826 | $667,400 | $185,800 | $481,600 |
| 2021 | $14,826 | $611,400 | $185,800 | $425,600 |
| 2020 | $14,590 | $604,400 | $185,800 | $418,600 |
| 2019 | $14,487 | $604,400 | $185,800 | $418,600 |
| 2018 | $14,457 | $594,200 | $185,800 | $408,400 |
| 2017 | $13,534 | $563,700 | $160,800 | $402,900 |
| 2016 | $13,236 | $558,000 | $160,800 | $397,200 |
| 2015 | $12,939 | $551,300 | $167,800 | $383,500 |
| 2014 | $13,033 | $559,600 | $147,800 | $411,800 |
Source: Public Records
Map
Nearby Homes
- 164 Ellisdale Rd
- 30 Ridgeview Way
- 10 Powderhorn Way
- 33 Bunker Hill Dr
- 40 Bunker Hill Dr
- 7 Corral Dr
- 35 Church St
- 3 Johnson Dr
- 3 Dartmouth Ct
- 9 Meetinghouse Rd
- STONEHAVEN II Plan at Old York Estates
- 5 Meetinghouse Rd
- 8 Coates Rd
- 9 Woodfield Ln
- 11 Probasco Dr
- 296 Extonville Rd
- 79 Potts Rd
- 81 Potts Rd
- 45 Circle Dr
- 0 Merrick Rd