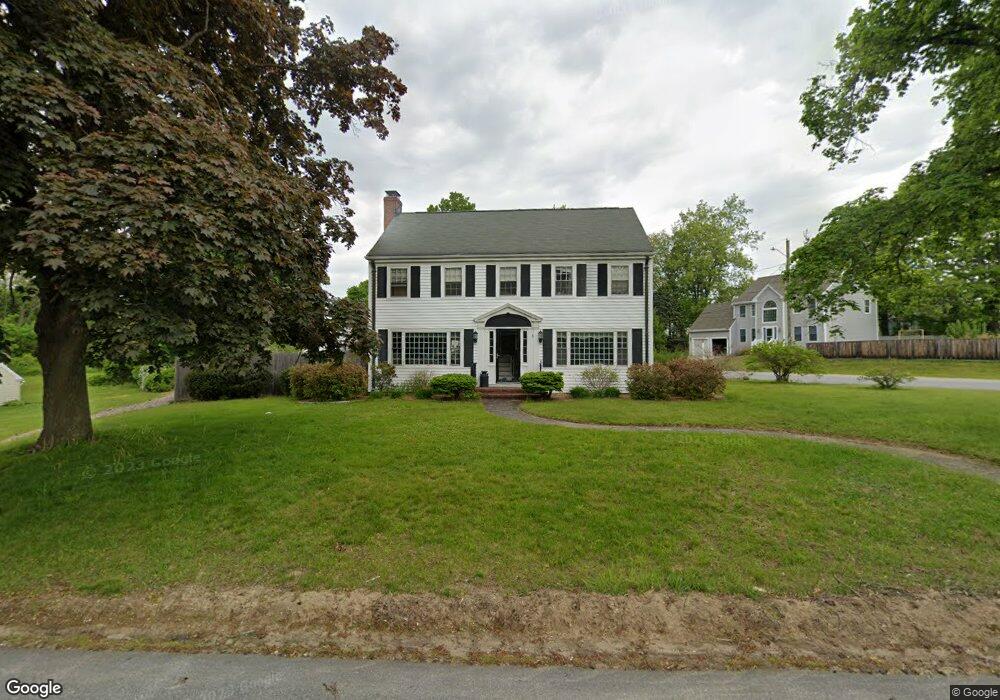
3 Lowell Ave Dover, NH 03820
Dover AreaEstimated Value: $561,000 - $729,000
About This Home
This home is located at 3 Lowell Ave, Dover, NH 03820 and is currently estimated at $616,966, approximately $299 per square foot. 3 Lowell Ave is a home located in Strafford County with nearby schools including Horne Street School, Dover Middle School, and Dover Senior High School.
Ownership History
We collect this data history from publicly available records. To have your information removed, we recommend requesting removal directly through your county’s website.
Purchase Details
Home Values in the Area
Average Home Value in this Area
Purchase History
We collect this data history from publicly available records. To have your information removed, we recommend requesting removal directly through your county’s website.
| Date | Buyer | Sale Price | Title Company |
|---|---|---|---|
| $187,000 | -- |
Tax History
We collect this data history from publicly available records. To have your information removed, we recommend requesting removal directly through your county’s website.
| Year | Tax Paid | Tax Assessment Tax Assessment Total Assessment is a certain percentage of the fair market value that is determined by local assessors to be the total taxable value of land and additions on the property. | Land | Improvement |
|---|---|---|---|---|
| 2025 | $11,255 | $571,900 | $178,000 | $393,900 |
| 2024 | $10,391 | $571,900 | $178,000 | $393,900 |
| 2023 | $9,462 | $506,000 | $160,200 | $345,800 |
| 2022 | $9,364 | $472,000 | $160,200 | $311,800 |
| 2021 | $8,969 | $413,300 | $142,400 | $270,900 |
| 2020 | $8,735 | $351,500 | $129,100 | $222,400 |
| 2019 | $8,406 | $333,700 | $115,700 | $218,000 |
| 2018 | $7,720 | $309,800 | $97,900 | $211,900 |
| 2017 | $7,621 | $294,600 | $89,000 | $205,600 |
| 2016 | $7,519 | $286,000 | $91,200 | $194,800 |
| 2015 | $7,241 | $272,100 | $82,100 | $190,000 |
| 2014 | $7,077 | $272,100 | $82,100 | $190,000 |
| 2011 | $6,079 | $242,000 | $69,700 | $172,300 |
Map
- Lot 0 Page Ave
- 796 Central Ave Unit B BACK
- 796 Central Ave Unit A FRONT
- 815 Central Ave
- 6 Chesley St
- 725 Central Ave Unit 302
- 725 Central Ave Unit LL03
- 711 Central Ave Unit 1
- 34 Floral Ave Unit 2
- 15 Hull Ave
- 36 Oak St
- 32 Copley Dr
- 32 Rollins Rd
- 142 Broadway
- 22 1/2 Baker St
- 2 - B Fawn Dr Unit 2 - B
- 2 - A Fawn Dr Unit 2 - A
- 30 Whittier St
- 48 New York St Unit 48
- 45 New York St Unit 2
- 5 Lowell Ave
- 4 Page Ave
- 1 Page Ave
- 3 Page Ave
- 7 Lowell Ave
- 1 Lowell Ave
- 798 Central Ave
- 4 Lowell Ave
- 800 Central Ave
- 5 Page Ave
- 140 Mount Vernon St
- 6 Lowell Ave
- 796 1/2 Central Ave
- 796 1/2 Central Ave Unit 1
- 796 Central Ave
- 138 Mount Vernon St
- 802 Central Ave
- 6 Page Ave
- 7 Page Ave
- 183 Mount Vernon St
Ask me questions while you tour the home.