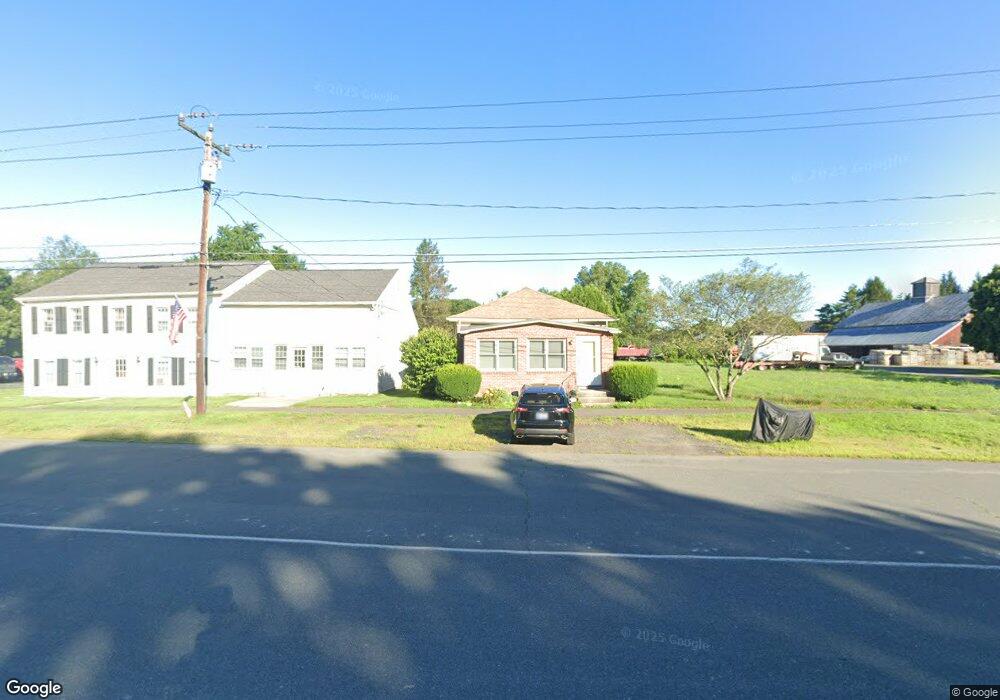
3 Main St Unit 1 Hatfield, MA 01038
Estimated Value: $294,000 - $396,000
2
Beds
1
Bath
1,136
Sq Ft
$300/Sq Ft
Est. Value
About This Home
This home is located at 3 Main St Unit 1, Hatfield, MA 01038 and is currently estimated at $341,275, approximately $300 per square foot. 3 Main St Unit 1 is a home located in Hampshire County with nearby schools including Browerville Elementary School, Brooklyn Center Middle School, and The Montessori School of Northampton.
Ownership History
Date
Name
Owned For
Owner Type
Purchase Details
Closed on
May 13, 2024
Sold by
Dostal Eileen J and Dostal Paul S
Bought by
Dostal Ft and Dostal
Current Estimated Value
Purchase Details
Closed on
Aug 26, 2003
Sold by
Bernson Steven E and Bernson Sandra S
Bought by
Dostal Paul S and Dostal Eileen J
Home Financials for this Owner
Home Financials are based on the most recent Mortgage that was taken out on this home.
Original Mortgage
$100,000
Interest Rate
5.52%
Mortgage Type
Purchase Money Mortgage
Purchase Details
Closed on
Apr 1, 1996
Sold by
Bernson Sandra S and Smith Charles
Bought by
Bernson Sandra S and Bernson Steven E
Home Financials for this Owner
Home Financials are based on the most recent Mortgage that was taken out on this home.
Original Mortgage
$56,600
Interest Rate
6.9%
Mortgage Type
Purchase Money Mortgage
Create a Home Valuation Report for This Property
The Home Valuation Report is an in-depth analysis detailing your home's value as well as a comparison with similar homes in the area
Home Values in the Area
Average Home Value in this Area
Purchase History
| Date | Buyer | Sale Price | Title Company |
|---|---|---|---|
| Dostal Ft | -- | None Available | |
| Dostal Ft | -- | None Available | |
| Dostal Paul S | $135,500 | -- | |
| Dostal Paul S | $135,500 | -- | |
| Bernson Sandra S | $85,000 | -- | |
| Bernson Sandra S | $85,000 | -- |
Source: Public Records
Mortgage History
| Date | Status | Borrower | Loan Amount |
|---|---|---|---|
| Previous Owner | Bernson Sandra S | $100,000 | |
| Previous Owner | Bernson Sandra S | $53,000 | |
| Previous Owner | Bernson Sandra S | $56,600 |
Source: Public Records
Tax History Compared to Growth
Tax History
| Year | Tax Paid | Tax Assessment Tax Assessment Total Assessment is a certain percentage of the fair market value that is determined by local assessors to be the total taxable value of land and additions on the property. | Land | Improvement |
|---|---|---|---|---|
| 2025 | $4,205 | $303,800 | $131,100 | $172,700 |
| 2024 | $4,014 | $262,200 | $120,600 | $141,600 |
| 2023 | $3,404 | $252,500 | $114,100 | $138,400 |
| 2022 | $3,379 | $247,200 | $108,800 | $138,400 |
| 2021 | $3,284 | $231,400 | $98,300 | $133,100 |
| 2020 | $3,131 | $231,400 | $98,300 | $133,100 |
| 2019 | $2,921 | $210,300 | $91,800 | $118,500 |
| 2018 | $2,912 | $214,400 | $91,800 | $122,600 |
| 2017 | $2,711 | $205,100 | $91,800 | $113,300 |
| 2016 | $2,722 | $206,500 | $91,800 | $114,700 |
| 2015 | $2,610 | $198,200 | $87,800 | $110,400 |
| 2014 | $2,511 | $198,200 | $87,800 | $110,400 |
Source: Public Records
Map
Nearby Homes