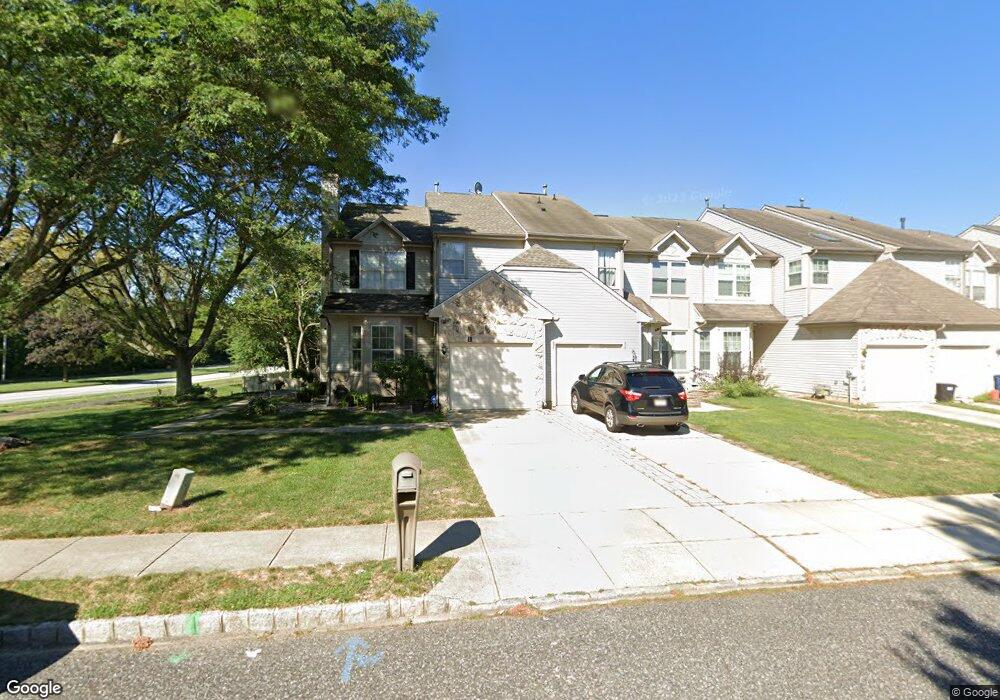
3 Manchester Way Burlington, NJ 08016
Estimated Value: $397,615 - $470,000
--
Bed
--
Bath
1,877
Sq Ft
$231/Sq Ft
Est. Value
About This Home
This home is located at 3 Manchester Way, Burlington, NJ 08016 and is currently estimated at $433,154, approximately $230 per square foot. 3 Manchester Way is a home located in Burlington County with nearby schools including B Bernice Young Elementary School, Fountain Woods Elementary School, and Burlington Township Middle School at Springside.
Ownership History
Date
Name
Owned For
Owner Type
Purchase Details
Closed on
Aug 26, 2004
Sold by
Gordon Gloria J
Bought by
Lee Bryan C and Lee Cheryl A
Current Estimated Value
Home Financials for this Owner
Home Financials are based on the most recent Mortgage that was taken out on this home.
Original Mortgage
$247,350
Outstanding Balance
$122,625
Interest Rate
5.89%
Mortgage Type
Purchase Money Mortgage
Estimated Equity
$310,529
Purchase Details
Closed on
May 24, 2001
Sold by
Federal National Mortgage Association
Bought by
Gordon Gloria
Home Financials for this Owner
Home Financials are based on the most recent Mortgage that was taken out on this home.
Original Mortgage
$148,200
Interest Rate
7.09%
Purchase Details
Closed on
Jan 10, 2000
Sold by
Mangano Deborah A and New Jersey Housing & Mtg Finan
Bought by
Federal National Mortgage Association
Create a Home Valuation Report for This Property
The Home Valuation Report is an in-depth analysis detailing your home's value as well as a comparison with similar homes in the area
Home Values in the Area
Average Home Value in this Area
Purchase History
| Date | Buyer | Sale Price | Title Company |
|---|---|---|---|
| Lee Bryan C | $255,000 | Congress Title Corp | |
| Gordon Gloria | $156,000 | T A Title | |
| Federal National Mortgage Association | -- | Stewart Title Guaranty Compa |
Source: Public Records
Mortgage History
| Date | Status | Borrower | Loan Amount |
|---|---|---|---|
| Open | Lee Bryan C | $247,350 | |
| Previous Owner | Gordon Gloria | $148,200 |
Source: Public Records
Tax History Compared to Growth
Tax History
| Year | Tax Paid | Tax Assessment Tax Assessment Total Assessment is a certain percentage of the fair market value that is determined by local assessors to be the total taxable value of land and additions on the property. | Land | Improvement |
|---|---|---|---|---|
| 2025 | $6,310 | $208,100 | $46,600 | $161,500 |
| 2024 | $6,216 | $208,100 | $46,600 | $161,500 |
| 2023 | $6,216 | $208,100 | $46,600 | $161,500 |
| 2022 | $6,189 | $208,100 | $46,600 | $161,500 |
| 2021 | $6,251 | $208,100 | $46,600 | $161,500 |
| 2020 | $6,237 | $208,100 | $46,600 | $161,500 |
| 2019 | $6,251 | $208,100 | $46,600 | $161,500 |
| 2018 | $6,158 | $208,100 | $46,600 | $161,500 |
| 2017 | $6,120 | $208,100 | $46,600 | $161,500 |
| 2016 | $5,940 | $198,000 | $32,000 | $166,000 |
| 2015 | $5,837 | $198,000 | $32,000 | $166,000 |
| 2014 | $5,623 | $198,000 | $32,000 | $166,000 |
Source: Public Records
Map
Nearby Homes
- 14 Shelburne St
- 9 Shelburne St
- 19 Pastern Terrace
- 7 Brentwood Dr
- 208 Whisper Ct Unit 208
- 16 Dogwood Dr
- 44 Wesley Ln
- 39 Fernbrooke Dr
- 9 Roberts Dr
- 5 Roberts Dr
- 204 Dale Rd
- 802 Garnet Dr Unit 8B
- 2502 Rancocas Rd
- 22 Sawgrass Dr
- 724 Woodlane Rd
- 1605 Burlington Mt Holly Rd
- 1600 Mount Holly Rd
- 20 Greenbrier Dr
- 86 New Castle Ln
- 101 Bradford Ct
- 5 Manchester Way
- 1 Manchester Way
- 7 Manchester Way
- 9 Manchester Way
- 11 Manchester Way
- 47 Shelburne St
- 49 Shelburne St
- 51 Shelburne St
- 45 Shelburne St
- 13 Manchester Way
- 43 Shelburne St
- 41 Shelburne St
- 15 Manchester Way
- 2 Manchester Way
- 39 Shelburne St
- 53 Shelburne St
- 17 Manchester Way
- 4 Manchester Way
- 55 Shelburne St
- 6 Manchester Way