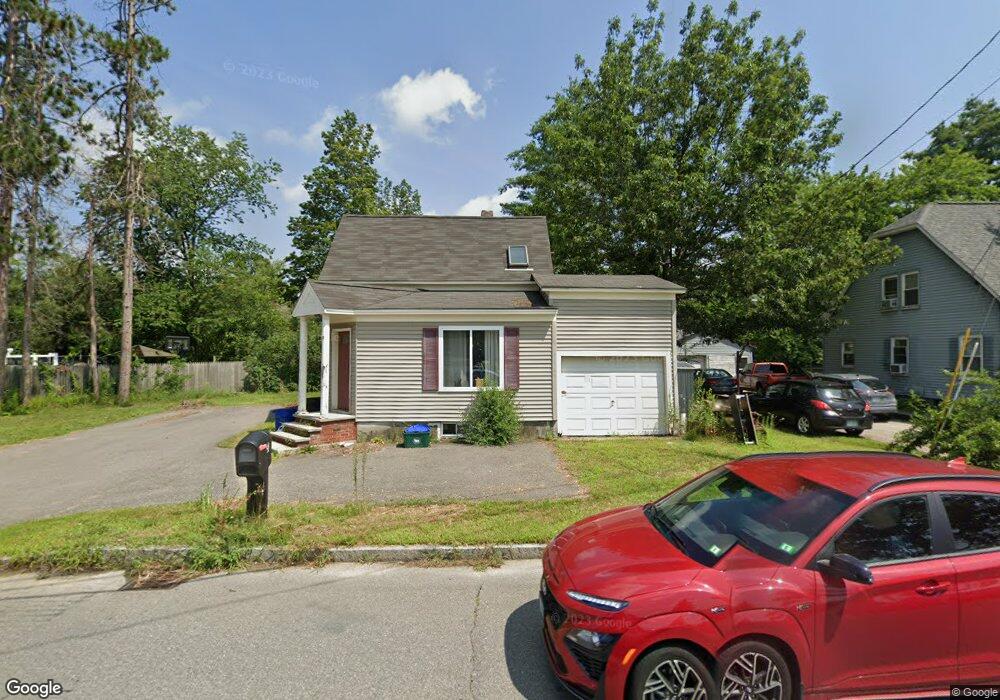
3 Manor Rd Concord, NH 03303
Penacook NeighborhoodEstimated Value: $395,441 - $481,000
3
Beds
1
Bath
1,676
Sq Ft
$272/Sq Ft
Est. Value
About This Home
This home is located at 3 Manor Rd, Concord, NH 03303 and is currently estimated at $455,360, approximately $271 per square foot. 3 Manor Rd is a home located in Merrimack County with nearby schools including Penacook Elementary School, Merrimack Valley Middle School, and Merrimack Valley High School.
Ownership History
Date
Name
Owned For
Owner Type
Purchase Details
Closed on
Jul 19, 2019
Sold by
Calley Scott and Higgins Kimberly A
Bought by
Higgins Kimberly A
Current Estimated Value
Home Financials for this Owner
Home Financials are based on the most recent Mortgage that was taken out on this home.
Original Mortgage
$171,000
Outstanding Balance
$149,750
Interest Rate
3.8%
Mortgage Type
Adjustable Rate Mortgage/ARM
Estimated Equity
$305,610
Purchase Details
Closed on
Oct 27, 2005
Sold by
Dion Denis R
Bought by
Higgins Kimberly A
Home Financials for this Owner
Home Financials are based on the most recent Mortgage that was taken out on this home.
Original Mortgage
$164,000
Interest Rate
7%
Mortgage Type
Adjustable Rate Mortgage/ARM
Purchase Details
Closed on
Dec 10, 1997
Sold by
Neff Walter
Bought by
Dion Denis R
Home Financials for this Owner
Home Financials are based on the most recent Mortgage that was taken out on this home.
Original Mortgage
$38,250
Interest Rate
7.14%
Mortgage Type
Purchase Money Mortgage
Create a Home Valuation Report for This Property
The Home Valuation Report is an in-depth analysis detailing your home's value as well as a comparison with similar homes in the area
Home Values in the Area
Average Home Value in this Area
Purchase History
| Date | Buyer | Sale Price | Title Company |
|---|---|---|---|
| Higgins Kimberly A | -- | -- | |
| Higgins Kimberly A | $205,000 | -- | |
| Higgins Kimberly A | $205,000 | -- | |
| Dion Denis R | $45,000 | -- |
Source: Public Records
Mortgage History
| Date | Status | Borrower | Loan Amount |
|---|---|---|---|
| Open | Higgins Kimberly A | $171,000 | |
| Previous Owner | Higgins Kimberly A | $164,000 | |
| Previous Owner | Dion Denis R | $38,250 |
Source: Public Records
Tax History Compared to Growth
Tax History
| Year | Tax Paid | Tax Assessment Tax Assessment Total Assessment is a certain percentage of the fair market value that is determined by local assessors to be the total taxable value of land and additions on the property. | Land | Improvement |
|---|---|---|---|---|
| 2024 | $7,688 | $250,900 | $101,200 | $149,700 |
| 2023 | $7,314 | $250,900 | $101,200 | $149,700 |
| 2022 | $7,309 | $250,900 | $101,200 | $149,700 |
| 2021 | $7,018 | $250,900 | $101,200 | $149,700 |
| 2020 | $6,770 | $226,200 | $81,100 | $145,100 |
| 2019 | $6,612 | $193,900 | $73,800 | $120,100 |
| 2018 | $6,623 | $197,100 | $73,800 | $123,300 |
| 2017 | $6,218 | $183,300 | $70,100 | $113,200 |
| 2016 | $4,715 | $170,400 | $63,700 | $106,700 |
| 2015 | $5,339 | $161,900 | $61,700 | $100,200 |
| 2014 | $5,247 | $161,900 | $61,700 | $100,200 |
| 2013 | -- | $162,000 | $61,800 | $100,200 |
| 2012 | -- | $170,700 | $61,800 | $108,900 |
Source: Public Records
Map
Nearby Homes
- 13 Suffolk Rd Unit 5
- 13 Suffolk Rd Unit 6
- 13 Suffolk Rd Unit 4
- 13 Suffolk Rd Unit 8
- 59 Hobart St
- 70 Abbott Rd
- 129 Fisherville Rd Unit 4
- 129 Fisherville Rd Unit 8
- 120 Fisherville Rd Unit 176
- 120 Fisherville Rd Unit 52
- 120 Fisherville Rd Unit 138
- 139 Abbott Rd
- 8 Woodbine Ave
- 18 Dawn Dr
- 4 Tanager Cir Unit 8
- 4 Tanager Cir Unit 7
- 4 Tanager Cir Unit 4
- 4 Tanager Cir Unit 3
- 4 Tanager Cir Unit 2
- 105 Lilac St
- 5 Manor Rd
- 8 Snow St
- 212 Fisherville Rd
- 4 Village St
- 6 Snow St
- 9 Manor Rd
- 16 Snow St
- 6 Village St
- 219 Fisherville Rd Unit C-1
- 219 Fisherville Rd Unit C2
- 219 Fisherville Rd Unit C1-2
- 219 Fisherville Rd Unit C-4
- 219 Fisherville Rd
- 219 Fisherville Rd Unit C-4
- 219 Fisherville Rd Unit C-1
- 219 Fisherville Rd Unit A-2
- 219 Fisherville Rd Unit B-2
- 219 Fisherville Rd Unit B-3
- 219 Fisherville Rd Unit A-2
- 13 Snow St