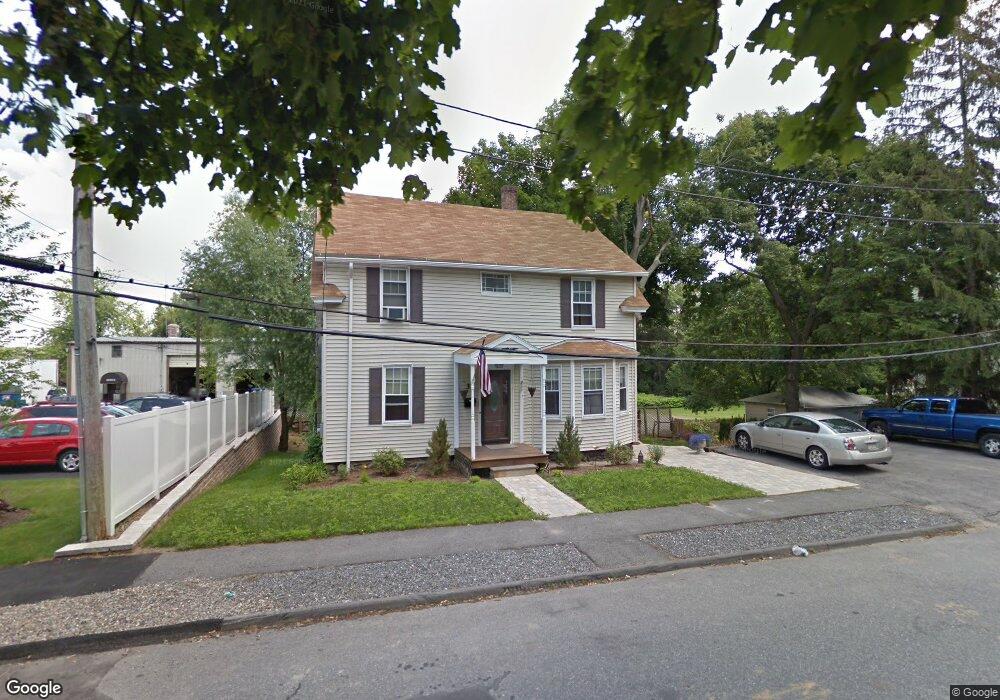
3 Marsh Ave Worcester, MA 01605
Estimated Value: $428,000 - $482,000
4
Beds
2
Baths
1,609
Sq Ft
$278/Sq Ft
Est. Value
About This Home
This home is located at 3 Marsh Ave, Worcester, MA 01605 and is currently estimated at $447,051, approximately $277 per square foot. 3 Marsh Ave is a home located in Worcester County with nearby schools including Jacob Hiatt Magnet School, Chandler Magnet, and Lincoln Street School.
Ownership History
Date
Name
Owned For
Owner Type
Purchase Details
Closed on
Apr 17, 2020
Sold by
Baker Jeffrey A and Baker Karen L
Bought by
Baker Jeffrey A and Baker Karen L
Current Estimated Value
Home Financials for this Owner
Home Financials are based on the most recent Mortgage that was taken out on this home.
Original Mortgage
$198,400
Outstanding Balance
$175,669
Interest Rate
3.6%
Mortgage Type
New Conventional
Estimated Equity
$271,382
Purchase Details
Closed on
Mar 30, 2001
Sold by
Birch Alan D and Birch Kathleen W
Bought by
Baker Jeffrey A and Letourneau Karen L
Create a Home Valuation Report for This Property
The Home Valuation Report is an in-depth analysis detailing your home's value as well as a comparison with similar homes in the area
Purchase History
| Date | Buyer | Sale Price | Title Company |
|---|---|---|---|
| Baker Jeffrey A | -- | None Available | |
| Baker Jeffrey A | $142,900 | -- |
Source: Public Records
Mortgage History
| Date | Status | Borrower | Loan Amount |
|---|---|---|---|
| Open | Baker Jeffrey A | $198,400 | |
| Previous Owner | Baker Jeffrey A | $209,612 | |
| Previous Owner | Baker Jeffrey A | $209,096 | |
| Previous Owner | Baker Jeffrey A | $174,000 |
Source: Public Records
Tax History
| Year | Tax Paid | Tax Assessment Tax Assessment Total Assessment is a certain percentage of the fair market value that is determined by local assessors to be the total taxable value of land and additions on the property. | Land | Improvement |
|---|---|---|---|---|
| 2025 | $5,160 | $391,200 | $118,300 | $272,900 |
| 2024 | $5,068 | $368,600 | $118,300 | $250,300 |
| 2023 | $4,861 | $339,000 | $102,900 | $236,100 |
| 2022 | $4,478 | $294,400 | $82,300 | $212,100 |
| 2021 | $4,314 | $265,000 | $65,900 | $199,100 |
| 2020 | $4,194 | $246,700 | $65,900 | $180,800 |
| 2019 | $4,041 | $224,500 | $59,300 | $165,200 |
| 2018 | $4,024 | $212,800 | $59,300 | $153,500 |
| 2017 | $3,879 | $201,800 | $59,300 | $142,500 |
| 2016 | $3,823 | $185,500 | $43,300 | $142,200 |
| 2015 | $3,723 | $185,500 | $43,300 | $142,200 |
| 2014 | $3,625 | $185,500 | $43,300 | $142,200 |
Source: Public Records
Map
Nearby Homes
- 110 Beverly Rd
- 36 Melrose St
- 5 Wakefield St
- 2 Selden St
- 18 Davidson Rd
- 100 Burncoat St
- 33 Denmark St
- 25 Kenwood Ave
- 51 Uxbridge St
- 3205 Halcyon Dr Unit 3205
- 2101 Halcyon Dr Unit 2101
- 22 Huron Ave
- 249 Lincoln St
- 39 Bullard Ave
- 6 Ashburnham Rd
- 655 Plantation St Unit 20B
- 27 Harlow St
- 78 Green Hill Pkwy
- 79 Humes Ave
- 2 Teconnett Path
- 7 Marsh Ave
- 455 Lincoln St
- 8 Marsh Ave
- 4 Marsh Ave
- 9 Marsh Ave
- 6 Marsh Ave
- 453 Lincoln St
- 10 Marsh Ave
- 11 Marsh Ave
- 11 Marsh Ave Unit 2
- 1 Bates Ave
- 3 Bates Ave
- 3 Bates Ave Unit 2
- 12 Marsh Ave
- 13 Marsh Ave
- 9 Bates Ave
- 9 Bates Ave Unit SI ID1380182P
- 9 Bates Ave Unit ID1380182P
- 14 Marsh Ave
- 3 Andrews Ave
Your Personal Tour Guide
Ask me questions while you tour the home.