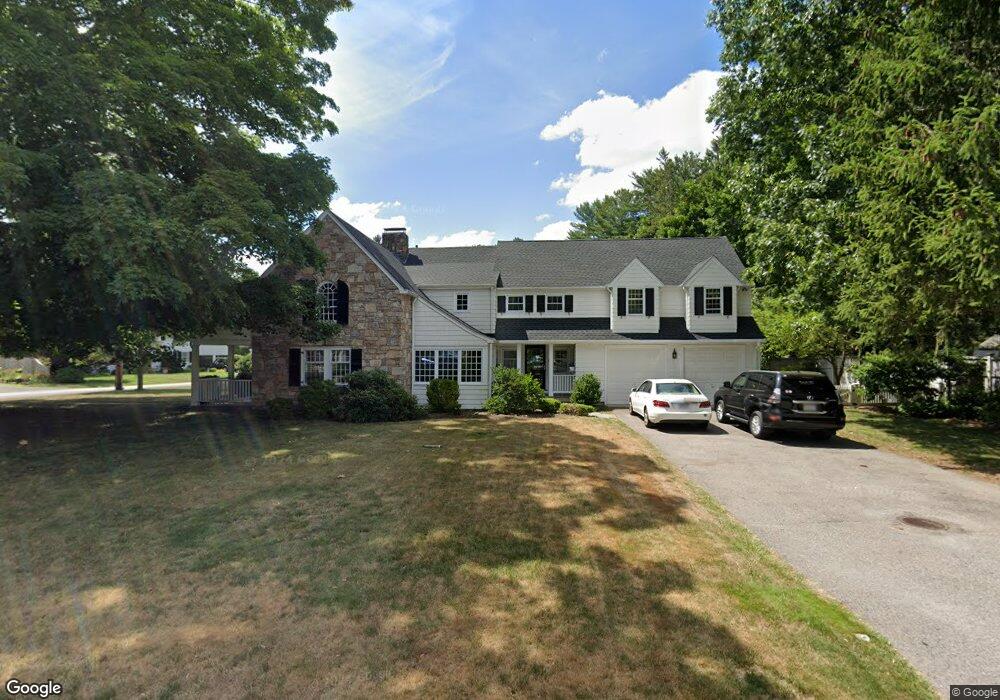
3 Marvin Rd Wellesley, MA 02482
Dana Hall NeighborhoodEstimated Value: $2,355,000 - $2,508,000
4
Beds
3
Baths
3,678
Sq Ft
$651/Sq Ft
Est. Value
About This Home
This home is located at 3 Marvin Rd, Wellesley, MA 02482 and is currently estimated at $2,393,263, approximately $650 per square foot. 3 Marvin Rd is a home located in Norfolk County with nearby schools including Hunnewell Elementary School, Wellesley Middle School, and Wellesley Sr High School.
Ownership History
Date
Name
Owned For
Owner Type
Purchase Details
Closed on
Jul 1, 2008
Sold by
May Peter and May Eileen M
Bought by
Santo Frank A and Santo Stacey A
Current Estimated Value
Home Financials for this Owner
Home Financials are based on the most recent Mortgage that was taken out on this home.
Original Mortgage
$417,000
Outstanding Balance
$269,019
Interest Rate
6.07%
Mortgage Type
Purchase Money Mortgage
Estimated Equity
$2,124,244
Purchase Details
Closed on
Apr 26, 1991
Sold by
Larratt Linda M
Bought by
May Peter and May Eileen M
Create a Home Valuation Report for This Property
The Home Valuation Report is an in-depth analysis detailing your home's value as well as a comparison with similar homes in the area
Home Values in the Area
Average Home Value in this Area
Purchase History
| Date | Buyer | Sale Price | Title Company |
|---|---|---|---|
| Santo Frank A | $1,200,000 | -- | |
| May Peter | $305,000 | -- |
Source: Public Records
Mortgage History
| Date | Status | Borrower | Loan Amount |
|---|---|---|---|
| Open | Santo Frank A | $417,000 | |
| Previous Owner | May Peter | $610,000 | |
| Previous Owner | May Peter | $418,000 |
Source: Public Records
Tax History
| Year | Tax Paid | Tax Assessment Tax Assessment Total Assessment is a certain percentage of the fair market value that is determined by local assessors to be the total taxable value of land and additions on the property. | Land | Improvement |
|---|---|---|---|---|
| 2025 | $18,093 | $1,760,000 | $1,048,000 | $712,000 |
| 2024 | $16,604 | $1,595,000 | $1,001,000 | $594,000 |
| 2023 | $16,740 | $1,462,000 | $915,000 | $547,000 |
| 2022 | $15,324 | $1,312,000 | $756,000 | $556,000 |
| 2021 | $15,416 | $1,312,000 | $756,000 | $556,000 |
| 2020 | $15,167 | $1,312,000 | $756,000 | $556,000 |
| 2019 | $14,995 | $1,296,000 | $756,000 | $540,000 |
| 2018 | $15,463 | $1,294,000 | $727,000 | $567,000 |
| 2017 | $15,056 | $1,277,000 | $727,000 | $550,000 |
| 2016 | $14,551 | $1,230,000 | $715,000 | $515,000 |
| 2015 | $14,230 | $1,231,000 | $714,000 | $517,000 |
Source: Public Records
Map
Nearby Homes
- 65 Grove St Unit 152
- 85 Grove St Unit 311
- 85 Grove St Unit 306
- 85 Grove St Unit 203
- 15 Great Plain Ave
- 170 Benvenue St
- 5 Abbott St
- 100 Linden St Unit 111
- 78 Denton Rd
- 16 Oak St
- 63 Linden St Unit 1
- 63 Linden St Unit 6
- 11 Oak St Unit 43
- 45 Kingsbury St
- 26B Pleasant St Unit B
- 34 Pleasant St Unit 5
- 28 Rice St
- 20 Arden Rd
- 63 Oak St Unit B
- 3 Midland Rd
Your Personal Tour Guide
Ask me questions while you tour the home.