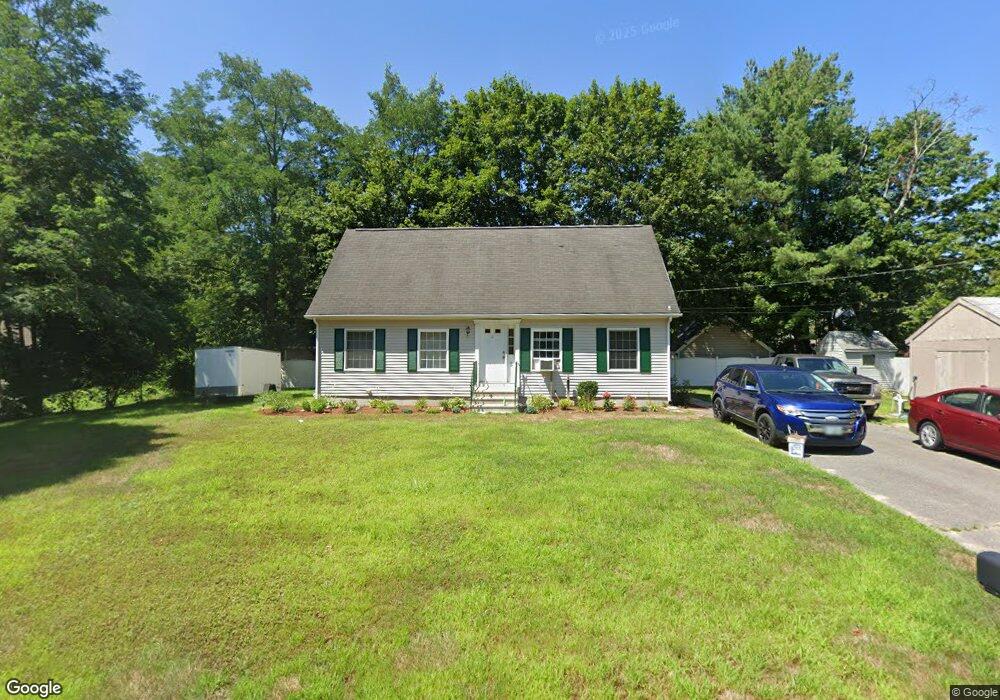
3 Milton St Attleboro, MA 02703
Estimated Value: $455,000 - $515,000
2
Beds
1
Bath
960
Sq Ft
$502/Sq Ft
Est. Value
About This Home
This home is located at 3 Milton St, Attleboro, MA 02703 and is currently estimated at $481,972, approximately $502 per square foot. 3 Milton St is a home located in Bristol County with nearby schools including Thomas E. Willett School, Cyril K. Brennan Middle School, and Attleboro High School.
Ownership History
Date
Name
Owned For
Owner Type
Purchase Details
Closed on
Oct 19, 1998
Sold by
Steeple Chase Inc
Bought by
Reed Glenn E
Current Estimated Value
Home Financials for this Owner
Home Financials are based on the most recent Mortgage that was taken out on this home.
Original Mortgage
$80,000
Outstanding Balance
$17,364
Interest Rate
6.8%
Mortgage Type
Purchase Money Mortgage
Estimated Equity
$464,608
Purchase Details
Closed on
Jul 31, 1997
Sold by
Childs Winifred A
Bought by
Cwb Rt
Home Financials for this Owner
Home Financials are based on the most recent Mortgage that was taken out on this home.
Original Mortgage
$70,000
Interest Rate
7.55%
Mortgage Type
Purchase Money Mortgage
Purchase Details
Closed on
Sep 16, 1991
Sold by
Parslow Donald I and Parslow Annette
Bought by
Reed Ernest A and Reed Florence E
Create a Home Valuation Report for This Property
The Home Valuation Report is an in-depth analysis detailing your home's value as well as a comparison with similar homes in the area
Home Values in the Area
Average Home Value in this Area
Purchase History
| Date | Buyer | Sale Price | Title Company |
|---|---|---|---|
| Reed Glenn E | $123,900 | -- | |
| Cwb Rt | $25,000 | -- | |
| Reed Ernest A | $99,400 | -- |
Source: Public Records
Mortgage History
| Date | Status | Borrower | Loan Amount |
|---|---|---|---|
| Open | Reed Ernest A | $28,000 | |
| Closed | Reed Ernest A | $14,000 | |
| Open | Reed Ernest A | $80,000 | |
| Previous Owner | Reed Ernest A | $70,000 |
Source: Public Records
Tax History
| Year | Tax Paid | Tax Assessment Tax Assessment Total Assessment is a certain percentage of the fair market value that is determined by local assessors to be the total taxable value of land and additions on the property. | Land | Improvement |
|---|---|---|---|---|
| 2025 | $5,443 | $433,700 | $163,100 | $270,600 |
| 2024 | $5,065 | $397,900 | $146,800 | $251,100 |
| 2023 | $4,938 | $360,700 | $148,200 | $212,500 |
| 2022 | $4,680 | $323,900 | $141,200 | $182,700 |
| 2021 | $4,538 | $306,600 | $135,800 | $170,800 |
| 2020 | $4,295 | $295,000 | $129,800 | $165,200 |
| 2019 | $4,041 | $285,400 | $127,200 | $158,200 |
| 2018 | $3,853 | $260,000 | $123,500 | $136,500 |
| 2017 | $3,684 | $253,200 | $120,400 | $132,800 |
| 2016 | $3,354 | $226,300 | $102,700 | $123,600 |
| 2015 | $3,170 | $215,500 | $102,700 | $112,800 |
| 2014 | $3,084 | $207,700 | $97,800 | $109,900 |
Source: Public Records
Map
Nearby Homes
- 933 Pleasant St
- 123 Pike Ave
- 67 Steeple Chase Cir Unit 1
- 214 Pike Ave
- 0 Pike Ave
- 11 Cherry Tree Ln
- 171 Pleasant St
- 19 Cherry Tree Ln
- 231 Park St
- 63 Hope St
- 45 Holman St
- 345 Richardson Ave
- 366 & 0 Pike Ave
- 28 Pine St Unit C
- 0 Alvin St (Lot 501)
- 4 Village Way Unit F
- 32 Park St Unit 4
- 10 Walter St
- 61 Pine St Unit 9
- 91 East St