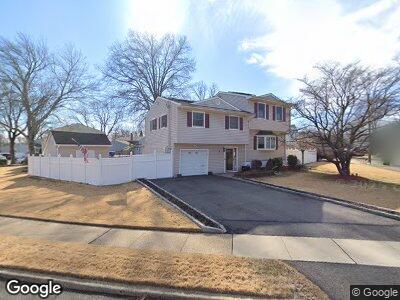
3 Moryan Rd Edison, NJ 08817
Estimated Value: $595,293 - $707,000
--
Bed
--
Bath
2,046
Sq Ft
$323/Sq Ft
Est. Value
About This Home
This home is located at 3 Moryan Rd, Edison, NJ 08817 and is currently estimated at $660,323, approximately $322 per square foot. 3 Moryan Rd is a home located in Middlesex County with nearby schools including Lincoln Elementary School, Herbert Hoover Middle School, and Edison High School.
Ownership History
Date
Name
Owned For
Owner Type
Purchase Details
Closed on
Jul 27, 2000
Sold by
Oge Raymond
Bought by
Stanton John and Stanton Barbara
Current Estimated Value
Home Financials for this Owner
Home Financials are based on the most recent Mortgage that was taken out on this home.
Original Mortgage
$165,000
Interest Rate
8.21%
Purchase Details
Closed on
May 23, 1995
Sold by
Hill Selina
Bought by
Oge Ray and Oge Mia
Home Financials for this Owner
Home Financials are based on the most recent Mortgage that was taken out on this home.
Original Mortgage
$149,000
Interest Rate
8.2%
Create a Home Valuation Report for This Property
The Home Valuation Report is an in-depth analysis detailing your home's value as well as a comparison with similar homes in the area
Home Values in the Area
Average Home Value in this Area
Purchase History
| Date | Buyer | Sale Price | Title Company |
|---|---|---|---|
| Stanton John | $210,000 | -- | |
| Oge Ray | $157,000 | -- |
Source: Public Records
Mortgage History
| Date | Status | Borrower | Loan Amount |
|---|---|---|---|
| Open | Stanton John R | $118,553 | |
| Open | Stanton John R | $220,000 | |
| Closed | Stnton John R | $150,000 | |
| Closed | Stanton John R | $145,210 | |
| Closed | Stanton John | $165,000 | |
| Previous Owner | Oge Ray | $149,000 |
Source: Public Records
Tax History Compared to Growth
Tax History
| Year | Tax Paid | Tax Assessment Tax Assessment Total Assessment is a certain percentage of the fair market value that is determined by local assessors to be the total taxable value of land and additions on the property. | Land | Improvement |
|---|---|---|---|---|
| 2024 | $11,280 | $190,500 | $95,600 | $94,900 |
| 2023 | $11,280 | $190,500 | $95,600 | $94,900 |
| 2022 | $11,283 | $190,500 | $95,600 | $94,900 |
| 2021 | $11,245 | $190,500 | $95,600 | $94,900 |
| 2020 | $11,142 | $190,500 | $95,600 | $94,900 |
| 2019 | $10,516 | $190,500 | $95,600 | $94,900 |
| 2018 | $10,237 | $190,500 | $95,600 | $94,900 |
| 2017 | $10,237 | $190,500 | $95,600 | $94,900 |
| 2016 | $10,051 | $190,500 | $95,600 | $94,900 |
| 2015 | $9,666 | $190,500 | $95,600 | $94,900 |
| 2014 | $9,384 | $190,500 | $95,600 | $94,900 |
Source: Public Records
Map
Nearby Homes