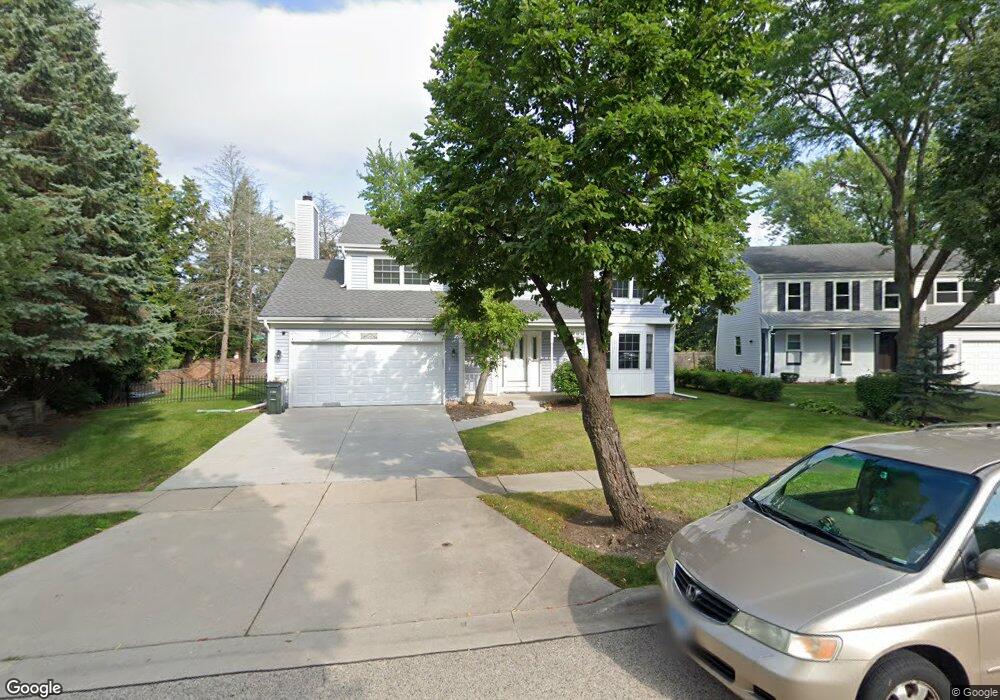
3 Newcastle Ct Mundelein, IL 60060
Cambridge Chase NeighborhoodEstimated Value: $467,986 - $591,000
--
Bed
3
Baths
2,239
Sq Ft
$226/Sq Ft
Est. Value
About This Home
This home is located at 3 Newcastle Ct, Mundelein, IL 60060 and is currently estimated at $506,997, approximately $226 per square foot. 3 Newcastle Ct is a home located in Lake County with nearby schools including Hawthorn Elementary School North, Hawthorn School Of Dual Language, and Hawthorn Middle School North.
Ownership History
Date
Name
Owned For
Owner Type
Purchase Details
Closed on
Nov 29, 1999
Sold by
Happ Patricia M and Happ Kevin M
Bought by
Parikh Kirti and Parikh Pallavi
Current Estimated Value
Home Financials for this Owner
Home Financials are based on the most recent Mortgage that was taken out on this home.
Original Mortgage
$195,000
Outstanding Balance
$61,781
Interest Rate
8.02%
Estimated Equity
$445,216
Purchase Details
Closed on
Jul 14, 1997
Sold by
Bockwinkel Gerald J and Bockwinkel Patricia
Bought by
Bockwinkel Happ Kevin Miller and Bockwinkel Happ Patricia
Home Financials for this Owner
Home Financials are based on the most recent Mortgage that was taken out on this home.
Original Mortgage
$52,000
Interest Rate
8%
Purchase Details
Closed on
May 31, 1996
Sold by
Bockwinkel Gerald J and Bockwinkel Patricia F
Bought by
Bockwinkel Gerald J and Bockwinkel Patricia F
Create a Home Valuation Report for This Property
The Home Valuation Report is an in-depth analysis detailing your home's value as well as a comparison with similar homes in the area
Home Values in the Area
Average Home Value in this Area
Purchase History
| Date | Buyer | Sale Price | Title Company |
|---|---|---|---|
| Parikh Kirti | $218,000 | -- | |
| Bockwinkel Happ Kevin Miller | -- | Chicago Title Insurance Co | |
| Bockwinkel Gerald J | -- | -- |
Source: Public Records
Mortgage History
| Date | Status | Borrower | Loan Amount |
|---|---|---|---|
| Open | Parikh Kirti | $195,000 | |
| Previous Owner | Bockwinkel Happ Kevin Miller | $52,000 |
Source: Public Records
Tax History Compared to Growth
Tax History
| Year | Tax Paid | Tax Assessment Tax Assessment Total Assessment is a certain percentage of the fair market value that is determined by local assessors to be the total taxable value of land and additions on the property. | Land | Improvement |
|---|---|---|---|---|
| 2024 | $11,017 | $134,901 | $25,346 | $109,555 |
| 2023 | $10,336 | $124,425 | $23,378 | $101,047 |
| 2022 | $10,336 | $112,464 | $22,471 | $89,993 |
| 2021 | $9,920 | $110,043 | $21,987 | $88,056 |
| 2020 | $10,132 | $108,193 | $21,617 | $86,576 |
| 2019 | $9,906 | $107,164 | $21,411 | $85,753 |
| 2018 | $5,180 | $103,304 | $20,549 | $82,755 |
| 2017 | $9,292 | $100,042 | $19,900 | $80,142 |
| 2016 | $8,898 | $94,854 | $18,868 | $75,986 |
| 2015 | $8,677 | $88,657 | $17,635 | $71,022 |
| 2014 | $8,106 | $81,430 | $16,124 | $65,306 |
| 2012 | $7,845 | $82,137 | $16,264 | $65,873 |
Source: Public Records
Map
Nearby Homes
- 422 Shadow Creek Dr
- 2245 Hazeltime Dr
- 1726 Shoal Creek Terrace
- 1255 Huntington Dr
- 1969 Royal Birkdale Dr
- 31 Washington Blvd Unit 108
- 1688 Saint Andrew Dr
- 1654 Pebble Beach Way
- 1017 Juniper Pkwy
- 1290 Butterfield Rd
- 215 Brice Ave
- 1939 Lake Charles Dr
- 49 N Shaddle Ave
- 1933 Lake Charles Dr
- 501 Hemlock Ln
- 841 Wilcox St
- 328 Brice Ave
- 1875 Lake Charles Dr
- 701 Thomas Ct
- 1855 Lake Charles Dr
- 9 Newcastle Ct
- 15 Newcastle Ct
- 3 Huntington Ct Unit 1
- 4 Newcastle Ct
- 2057 Trevino Terrace
- 10 Newcastle Ct
- 1448 Huntington Dr
- 16 Newcastle Ct
- 7 Huntington Ct
- 59 Knightsbridge Dr
- 415 Shadow Creek Dr
- 2053 Trevino Terrace
- 1441 Huntington Dr
- 53 Knightsbridge Dr
- 1444 Huntington Dr
- 419 Shadow Creek Dr
- 2056 Trevino Terrace
- 67 Knightsbridge Dr
- 1 S Windsor Place
- 423 Shadow Creek Dr