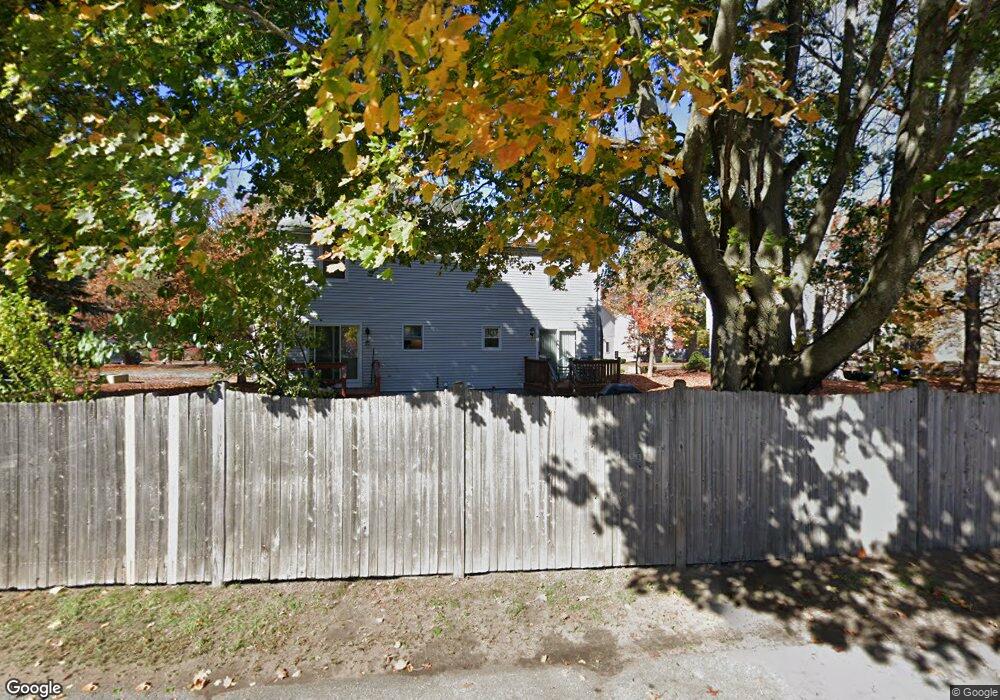
3 Northwoods Cir Unit 3 Woburn, MA 01801
North Woburn NeighborhoodEstimated Value: $489,000 - $569,000
2
Beds
2
Baths
1,422
Sq Ft
$373/Sq Ft
Est. Value
About This Home
This home is located at 3 Northwoods Cir Unit 3, Woburn, MA 01801 and is currently estimated at $530,002, approximately $372 per square foot. 3 Northwoods Cir Unit 3 is a home located in Middlesex County with nearby schools including Linscott-Rumford Elementary School, John F. Kennedy Middle School, and Woburn High School.
Ownership History
Date
Name
Owned For
Owner Type
Purchase Details
Closed on
Oct 13, 2010
Sold by
Hagan Dianne
Bought by
Conserve Regine
Current Estimated Value
Home Financials for this Owner
Home Financials are based on the most recent Mortgage that was taken out on this home.
Original Mortgage
$242,250
Outstanding Balance
$161,075
Interest Rate
4.5%
Mortgage Type
FHA
Estimated Equity
$368,927
Purchase Details
Closed on
Aug 31, 2005
Sold by
Maclean Betty L
Bought by
Hagan Dianne
Home Financials for this Owner
Home Financials are based on the most recent Mortgage that was taken out on this home.
Original Mortgage
$208,000
Interest Rate
5.81%
Mortgage Type
Purchase Money Mortgage
Purchase Details
Closed on
Sep 25, 1997
Sold by
Mottla Richard P
Bought by
Maclean Betty L
Home Financials for this Owner
Home Financials are based on the most recent Mortgage that was taken out on this home.
Original Mortgage
$109,800
Interest Rate
7.47%
Mortgage Type
Purchase Money Mortgage
Create a Home Valuation Report for This Property
The Home Valuation Report is an in-depth analysis detailing your home's value as well as a comparison with similar homes in the area
Home Values in the Area
Average Home Value in this Area
Purchase History
| Date | Buyer | Sale Price | Title Company |
|---|---|---|---|
| Conserve Regine | $250,000 | -- | |
| Hagan Dianne | $308,000 | -- | |
| Maclean Betty L | $122,000 | -- |
Source: Public Records
Mortgage History
| Date | Status | Borrower | Loan Amount |
|---|---|---|---|
| Open | Conserve Regine | $242,250 | |
| Previous Owner | Hagan Dianne | $208,000 | |
| Previous Owner | Maclean Betty L | $109,800 | |
| Previous Owner | Maclean Betty L | $104,000 |
Source: Public Records
Tax History Compared to Growth
Tax History
| Year | Tax Paid | Tax Assessment Tax Assessment Total Assessment is a certain percentage of the fair market value that is determined by local assessors to be the total taxable value of land and additions on the property. | Land | Improvement |
|---|---|---|---|---|
| 2025 | $4,282 | $501,400 | $0 | $501,400 |
| 2024 | $3,683 | $456,900 | $0 | $456,900 |
| 2023 | $3,805 | $437,300 | $0 | $437,300 |
| 2022 | $3,632 | $388,900 | $0 | $388,900 |
| 2021 | $3,685 | $395,000 | $0 | $395,000 |
| 2020 | $3,271 | $351,000 | $0 | $351,000 |
| 2019 | $3,124 | $328,800 | $0 | $328,800 |
| 2018 | $3,105 | $314,000 | $0 | $314,000 |
| 2017 | $2,690 | $270,600 | $0 | $270,600 |
| 2016 | $2,522 | $250,900 | $0 | $250,900 |
| 2015 | $2,425 | $238,400 | $0 | $238,400 |
| 2014 | $2,459 | $235,500 | $0 | $235,500 |
Source: Public Records
Map
Nearby Homes
- 16 Northwoods Cir Unit 16
- 34 Northwoods Cir
- 33 Northwoods Cir
- 32 Northwoods Cir
- 31 Northwoods Cir
- 30 Northwoods Cir
- 29 Northwoods Cir
- 28 Northwoods Cir
- 27 Northwoods Cir
- 26 Northwoods Cir
- 25 Northwoods Cir
- 24 Northwoods Cir
- 23 Northwoods Cir
- 22 Northwoods Cir
- 21 Northwoods Cir
- 20 Northwoods Cir
- 19 Northwoods Cir
- 18 Northwoods Cir
- 17 Northwoods Cir
- 16 Northwoods Cir