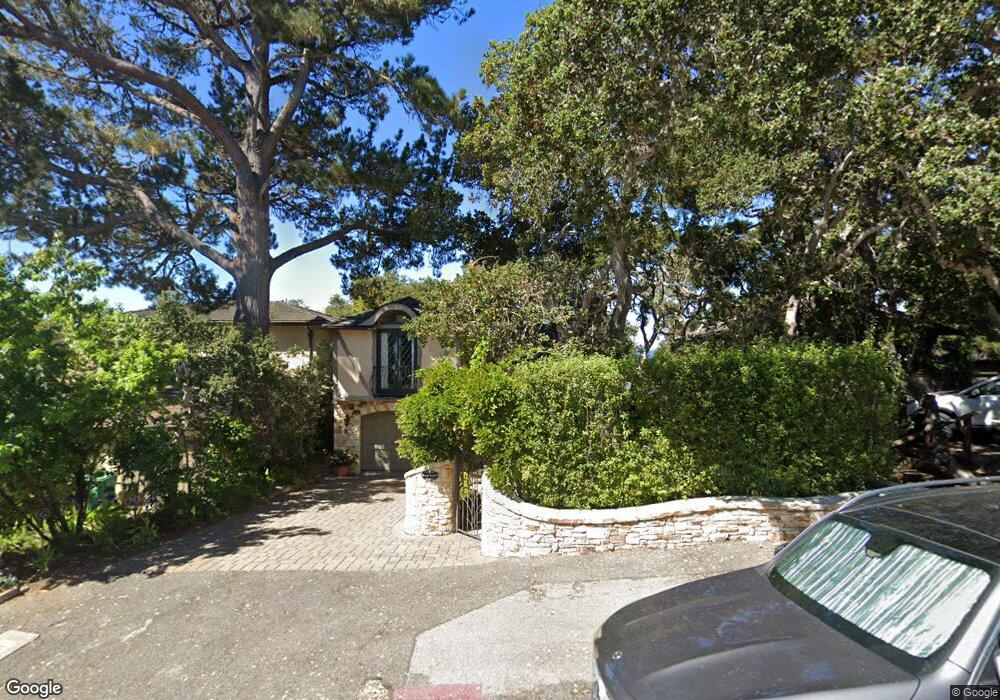
3 NW Monte Verde St Carmel, CA 93923
Carmel-By-The-Sea NeighborhoodEstimated Value: $1,924,000 - $3,497,000
3
Beds
2
Baths
1,581
Sq Ft
$1,714/Sq Ft
Est. Value
About This Home
This home is located at 3 NW Monte Verde St, Carmel, CA 93923 and is currently estimated at $2,710,500, approximately $1,714 per square foot. 3 NW Monte Verde St is a home with nearby schools including Carmel River Elementary School, Carmel Middle School, and Carmel High School.
Ownership History
Date
Name
Owned For
Owner Type
Purchase Details
Closed on
Jan 5, 2021
Sold by
Walters Robert H and Walters Charlene O
Bought by
Walters Robert H and Walters Chalene O
Current Estimated Value
Home Financials for this Owner
Home Financials are based on the most recent Mortgage that was taken out on this home.
Original Mortgage
$205,000
Interest Rate
2.71%
Mortgage Type
New Conventional
Purchase Details
Closed on
Mar 31, 2008
Sold by
Walters Charlene O and Charlene Mathews Revocable Tru
Bought by
Walters Robert H and Walters Charlene O
Purchase Details
Closed on
Mar 22, 2005
Sold by
Mathews Walters Charlene O and Mathews Charlene O
Bought by
Mathews Walters Charlene O and The Mathews Walters Family Tru
Purchase Details
Closed on
May 14, 1998
Sold by
Mathews Charlene O
Bought by
Mathews Charlene O and Charlene Mathews Revocable Tru
Create a Home Valuation Report for This Property
The Home Valuation Report is an in-depth analysis detailing your home's value as well as a comparison with similar homes in the area
Home Values in the Area
Average Home Value in this Area
Purchase History
| Date | Buyer | Sale Price | Title Company |
|---|---|---|---|
| Walters Robert H | -- | Placer Title Company | |
| Walters Robert H | -- | None Available | |
| Mathews Walters Charlene O | -- | -- | |
| Mathews Charlene O | -- | -- |
Source: Public Records
Mortgage History
| Date | Status | Borrower | Loan Amount |
|---|---|---|---|
| Closed | Walters Robert H | $205,000 |
Source: Public Records
Tax History
| Year | Tax Paid | Tax Assessment Tax Assessment Total Assessment is a certain percentage of the fair market value that is determined by local assessors to be the total taxable value of land and additions on the property. | Land | Improvement |
|---|---|---|---|---|
| 2025 | $4,750 | $369,846 | $37,551 | $332,295 |
| 2024 | $4,750 | $362,595 | $36,815 | $325,780 |
| 2023 | $4,810 | $355,487 | $36,094 | $319,393 |
| 2022 | $4,739 | $348,518 | $35,387 | $313,131 |
| 2021 | $4,574 | $341,686 | $34,694 | $306,992 |
| 2020 | $4,472 | $338,184 | $34,339 | $303,845 |
| 2019 | $4,378 | $331,554 | $33,666 | $297,888 |
| 2018 | $4,258 | $325,054 | $33,006 | $292,048 |
| 2017 | $4,123 | $318,681 | $32,359 | $286,322 |
| 2016 | $4,014 | $312,433 | $31,725 | $280,708 |
| 2015 | -- | $307,741 | $31,249 | $276,492 |
| 2014 | -- | $301,713 | $30,637 | $271,076 |
Source: Public Records
Map
Nearby Homes
- 0 Mission 4 Ne 5th St Unit 3N
- SW Corner San Carlos & 10th
- 0 Crespi 2 Ne of Flanders Way Unit ML82029312
- 0 Oak Knoll 2 Se of Forest Unit ML82034318
- 0 Lincoln 3 Sw of 10th Ave Unit ML82025179
- 0 St Unit ML82034672
- 3 Lincoln St
- 3 Monte Verde St
- 24817 Santa fe St
- 3225 Macomber Dr
- 24694 Dolores St
- 24584 Castro Ln
- 24805 Lower Trail
- 3239 Serra Ave
- 3360 Kingsley Ct
- 3540 Oak Place
- 26181 Valley View Ave
- 26126 Ladera Dr
- 1651 Crespi Ln
- 26231 Isabella Ave
- 2 6th Ave
- 3 6th Ave
- 1 5th Ave
- 7 Camino Real Nw of Ocean
- 7 Camino Real Unit REAL
- 7 Camino Real
- 4 Ocean Ave
- 0 NW Corner Casanova & Ocean Ave Unit ML82005443
- 0 NW Corner Casanova & Ocean St Unit ML82005443
- 5 Ocean Ave
- 1 Ocean Ave
- 7 Ocean Ave
- 8 Ocean Ave
- 2 5th Ave
- 2 5th St
- 3 Casanova St
- 7 Casanova St
- 5 Camino Real
- 3 NE of 2nd Monte Verde
- 2 Monte Verde St
Your Personal Tour Guide
Ask me questions while you tour the home.