Estimated Value: $188,089 - $264,000
Studio
--
Bath
2,582
Sq Ft
$88/Sq Ft
Est. Value
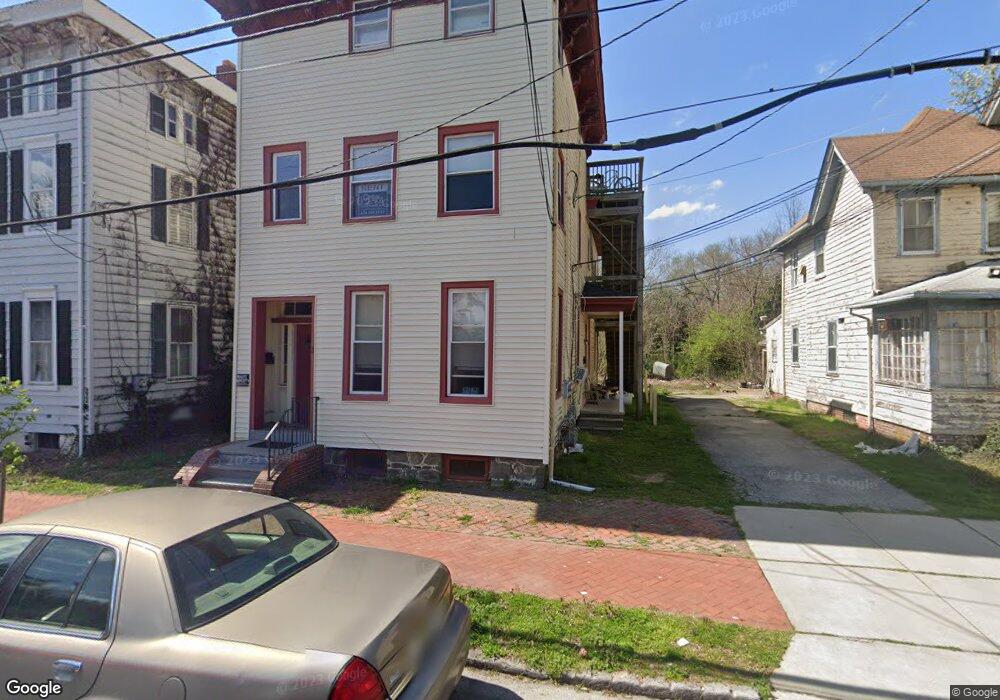
About This Home
This home is located at 3 Oak St, Salem, NJ 08079 and is currently estimated at $227,022, approximately $87 per square foot. 3 Oak St is a home located in Salem County with nearby schools including John Fenwick Elementary School, Salem Middle School, and Salem High School.
Ownership History
Date
Name
Owned For
Owner Type
Purchase Details
Closed on
Sep 30, 2021
Sold by
Fuse William G and Fuse Claudia D
Bought by
Maja Assets Llc
Current Estimated Value
Home Financials for this Owner
Home Financials are based on the most recent Mortgage that was taken out on this home.
Original Mortgage
$60,000
Outstanding Balance
$27,454
Interest Rate
2.8%
Mortgage Type
Seller Take Back
Estimated Equity
$199,568
Purchase Details
Closed on
Jul 23, 1998
Sold by
Major Victor and Major Patricia A
Bought by
Fuse William G and Fuse Claulia D
Create a Home Valuation Report for This Property
The Home Valuation Report is an in-depth analysis detailing your home's value as well as a comparison with similar homes in the area
Home Values in the Area
Average Home Value in this Area
Purchase History
| Date | Buyer | Sale Price | Title Company |
|---|---|---|---|
| Maja Assets Llc | $160,000 | West Jersey Title Agency | |
| Fuse William G | $35,000 | -- |
Source: Public Records
Mortgage History
| Date | Status | Borrower | Loan Amount |
|---|---|---|---|
| Open | Maja Assets Llc | $60,000 |
Source: Public Records
Tax History
| Year | Tax Paid | Tax Assessment Tax Assessment Total Assessment is a certain percentage of the fair market value that is determined by local assessors to be the total taxable value of land and additions on the property. | Land | Improvement |
|---|---|---|---|---|
| 2025 | $5,714 | $69,500 | $8,000 | $61,500 |
| 2024 | $5,463 | $69,500 | $8,000 | $61,500 |
Source: Public Records
Map
Nearby Homes
- 12 Oak St
- 95 Hedge St
- 120 Thompson St
- 69 Carpenter St
- 75 Hedge St Unit 2 RR
- 176 Griffith St
- 4 Belden St
- 183 E Broadway Unit C-8
- 183 E Broadway Unit C-27
- 196 198 E Broadway
- 6 Walnut St
- 59 Market St
- 55 Market St
- 187 7th St
- 12 Church St
- 210 Wesley St
- 79 Walnut St
- 155 Seventh St
- 154 Seventh St
- 78 Walnut St
Your Personal Tour Guide
Ask me questions while you tour the home.