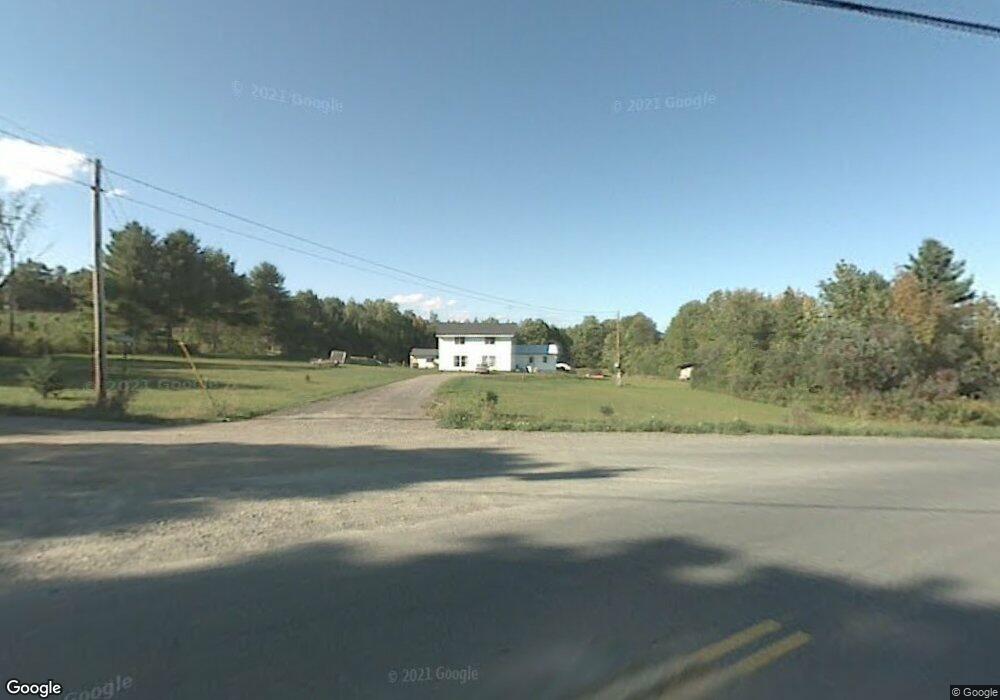
3 Parkman Rd Garland, ME 04939
3
Beds
2
Baths
2,188
Sq Ft
174,240
Sq Ft Lot
About This Home
This home is located at 3 Parkman Rd, Garland, ME 04939. 3 Parkman Rd is a home located in Penobscot County with nearby schools including Ridge View Community School and Dexter Regional High School.
Create a Home Valuation Report for This Property
The Home Valuation Report is an in-depth analysis detailing your home's value as well as a comparison with similar homes in the area
Tax History
| Year | Tax Paid | Tax Assessment Tax Assessment Total Assessment is a certain percentage of the fair market value that is determined by local assessors to be the total taxable value of land and additions on the property. | Land | Improvement |
|---|---|---|---|---|
| 2025 | $312 | $27,100 | $27,100 | $0 |
| 2024 | $277 | $25,400 | $25,400 | $0 |
| 2023 | $261 | $23,700 | $23,700 | $0 |
| 2021 | $356 | $23,700 | $23,700 | $0 |
| 2019 | $377 | $23,700 | $23,700 | $0 |
| 2018 | $329 | $23,700 | $23,700 | $0 |
| 2017 | $329 | $23,700 | $23,700 | $0 |
| 2016 | $479 | $33,400 | $33,400 | $0 |
| 2015 | $274 | $19,100 | $19,100 | $0 |
| 2014 | $274 | $19,100 | $19,100 | $0 |
| 2013 | $257 | $19,100 | $19,100 | $0 |
Source: Public Records
Map
Nearby Homes
- Lot #8 Kolm Ln
- 76 Dexter Rd
- 16 Dexter Rd
- 3 Corinth Rd
- 168 Corinth Rd
- 212 Campbell Rd
- 176 Millet Rd
- 68 Pullen Rd
- 296 Valley Avenue Rd
- 00 Oliver Hill Rd
- lot 26 Upper Garland Rd
- 839 Oliver Hill Rd
- 27 Atkins Rd
- 31 Swan Ln
- 150 Matteson Rd
- 1045 Dover Rd
- 168 Garland Line Rd
- 9 Jackson St
- 2382 Exeter Rd
- M07 L21-02 Dover Rd
Your Personal Tour Guide
Ask me questions while you tour the home.