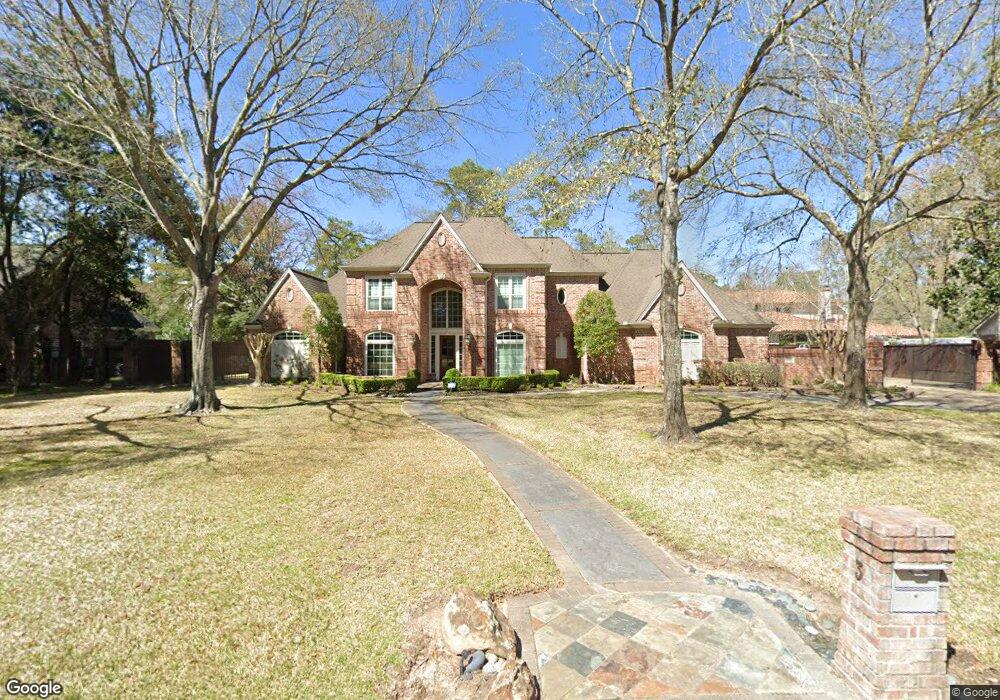
3 Patrick Ct Houston, TX 77024
Estimated Value: $2,336,814 - $2,641,000
4
Beds
5
Baths
4,543
Sq Ft
$557/Sq Ft
Est. Value
About This Home
This home is located at 3 Patrick Ct, Houston, TX 77024 and is currently estimated at $2,528,704, approximately $556 per square foot. 3 Patrick Ct is a home located in Harris County with nearby schools including Bunker Hill Elementary School, Memorial Middle, and Memorial High School.
Ownership History
Date
Name
Owned For
Owner Type
Purchase Details
Closed on
Apr 29, 2010
Sold by
Schrom Diana Owens
Bought by
Johnsen Eivind and Johnsen Alice L
Current Estimated Value
Home Financials for this Owner
Home Financials are based on the most recent Mortgage that was taken out on this home.
Original Mortgage
$980,000
Outstanding Balance
$634,598
Interest Rate
4.37%
Mortgage Type
New Conventional
Estimated Equity
$1,894,106
Purchase Details
Closed on
Dec 10, 1998
Sold by
Garnett Richard H and Garnett Suzanne W
Bought by
Schrom William S and Schrom Diana Owens
Home Financials for this Owner
Home Financials are based on the most recent Mortgage that was taken out on this home.
Original Mortgage
$475,000
Interest Rate
6.5%
Create a Home Valuation Report for This Property
The Home Valuation Report is an in-depth analysis detailing your home's value as well as a comparison with similar homes in the area
Home Values in the Area
Average Home Value in this Area
Purchase History
| Date | Buyer | Sale Price | Title Company |
|---|---|---|---|
| Johnsen Eivind | -- | Charter Title Company | |
| Schrom William S | -- | Charter Title Company |
Source: Public Records
Mortgage History
| Date | Status | Borrower | Loan Amount |
|---|---|---|---|
| Open | Johnsen Eivind | $980,000 | |
| Previous Owner | Schrom William S | $475,000 |
Source: Public Records
Tax History Compared to Growth
Tax History
| Year | Tax Paid | Tax Assessment Tax Assessment Total Assessment is a certain percentage of the fair market value that is determined by local assessors to be the total taxable value of land and additions on the property. | Land | Improvement |
|---|---|---|---|---|
| 2025 | $32,347 | $2,150,000 | $1,201,320 | $948,680 |
| 2024 | $32,347 | $2,064,328 | $1,161,276 | $903,052 |
| 2023 | $32,347 | $2,100,467 | $1,101,210 | $999,257 |
| 2022 | $38,666 | $2,073,679 | $1,101,210 | $972,469 |
| 2021 | $36,611 | $1,690,547 | $1,041,144 | $649,403 |
| 2020 | $37,035 | $1,721,999 | $1,041,144 | $680,855 |
| 2019 | $37,211 | $1,613,191 | $1,041,144 | $572,047 |
| 2018 | $8,829 | $1,737,545 | $1,041,144 | $696,401 |
| 2017 | $40,080 | $1,737,545 | $1,041,144 | $696,401 |
| 2016 | $37,149 | $1,737,545 | $1,041,144 | $696,401 |
| 2015 | $25,176 | $1,737,545 | $1,041,144 | $696,401 |
| 2014 | $25,176 | $1,475,216 | $900,990 | $574,226 |
Source: Public Records
Map
Nearby Homes
- 12003 Tall Oaks St
- 601 Strey Ln
- 11910 Heritage Ln
- 345 Knipp Rd
- 318 Knipp Rd
- 234 Plantation Rd
- 11718 Broken Bough Cir
- 12222 Broken Bough Dr
- 711 Timber Hill Dr
- 12334 Beauregard Dr
- 12326 Old Oaks Dr
- 12 Gage Ct
- 170 Haversham Dr
- 358 Tealwood Dr
- 354 Tealwood Dr
- 11640 Greenbay St
- 12327 Tunbridge Ln
- 517 Flintdale Rd
- 0 Gessner Rd
- 11706 Flintwood Dr
- 4 Rip Van Winkle Ln
- 1 Patrick Ct
- 5 Patrick Ct
- 2 Rip Van Winkle Ln
- 4 Patrick Ct
- 2 Patrick Ct
- 6 Patrick Ct
- 7 Patrick Ct
- 6 Rip Van Winkle Ln
- 11930 Surrey Ln
- 3 Rip Van Winkle Ln
- 1 Rip Van Winkle Ln
- 8 Patrick Ct
- 11934 Surrey Ln
- 11926 Surrey Ln
- 12010 Tall Oaks St
- 5 Rip Van Winkle Ln
- 2 Duchess Ct
- 11919 Churchill Ct
- 11922 Surrey Ln