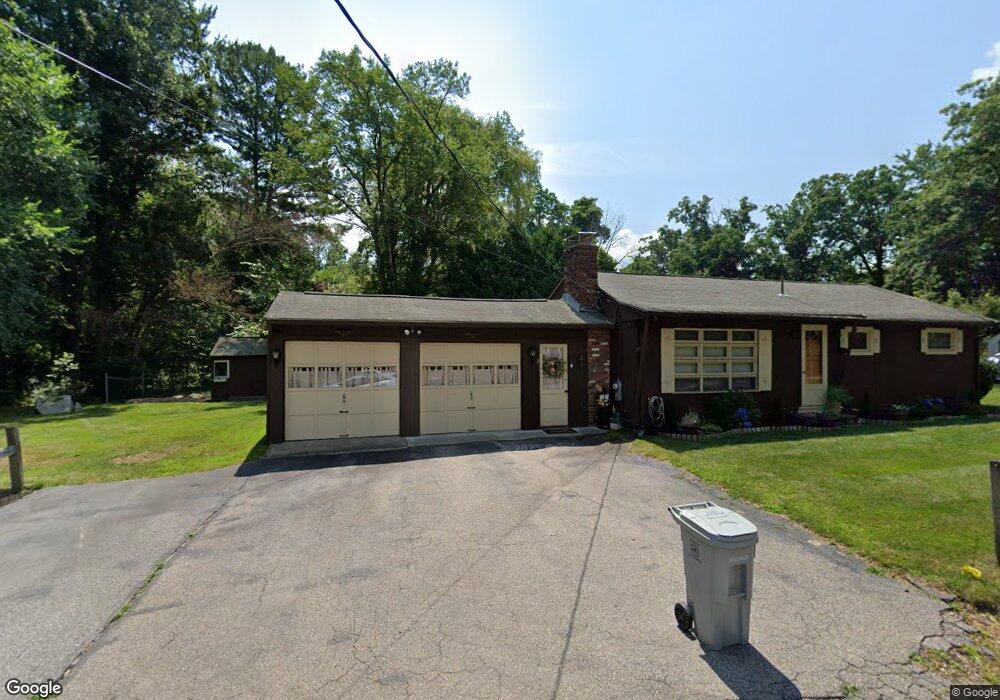
3 Pine Oak St Holliston, MA 01746
Estimated Value: $476,153 - $564,000
2
Beds
1
Bath
792
Sq Ft
$647/Sq Ft
Est. Value
About This Home
This home is located at 3 Pine Oak St, Holliston, MA 01746 and is currently estimated at $512,538, approximately $647 per square foot. 3 Pine Oak St is a home located in Middlesex County with nearby schools including Placentino Elementary School, Miller Elementary School, and Robert H. Adams Middle School.
Ownership History
Date
Name
Owned For
Owner Type
Purchase Details
Closed on
Jul 29, 2025
Sold by
Joy Mona F
Bought by
3 Pine Oak Street Llc
Current Estimated Value
Home Financials for this Owner
Home Financials are based on the most recent Mortgage that was taken out on this home.
Original Mortgage
$600,000
Outstanding Balance
$599,489
Interest Rate
6.81%
Mortgage Type
New Conventional
Estimated Equity
-$77,276
Create a Home Valuation Report for This Property
The Home Valuation Report is an in-depth analysis detailing your home's value as well as a comparison with similar homes in the area
Home Values in the Area
Average Home Value in this Area
Purchase History
| Date | Buyer | Sale Price | Title Company |
|---|---|---|---|
| 3 Pine Oak Street Llc | $325,000 | -- | |
| 3 Pine Oak Street Llc | $325,000 | -- |
Source: Public Records
Mortgage History
| Date | Status | Borrower | Loan Amount |
|---|---|---|---|
| Open | 3 Pine Oak Street Llc | $600,000 | |
| Closed | 3 Pine Oak Street Llc | $600,000 |
Source: Public Records
Tax History Compared to Growth
Tax History
| Year | Tax Paid | Tax Assessment Tax Assessment Total Assessment is a certain percentage of the fair market value that is determined by local assessors to be the total taxable value of land and additions on the property. | Land | Improvement |
|---|---|---|---|---|
| 2025 | $6,130 | $418,400 | $268,400 | $150,000 |
| 2024 | $5,885 | $390,800 | $268,400 | $122,400 |
| 2023 | $5,969 | $387,600 | $268,400 | $119,200 |
| 2022 | $6,140 | $353,300 | $268,400 | $84,900 |
| 2021 | $5,940 | $332,800 | $246,100 | $86,700 |
| 2020 | $6,038 | $320,300 | $242,600 | $77,700 |
| 2019 | $5,495 | $291,800 | $211,000 | $80,800 |
| 2018 | $5,448 | $291,800 | $211,000 | $80,800 |
| 2017 | $5,082 | $274,400 | $203,000 | $71,400 |
| 2016 | $4,679 | $249,000 | $177,600 | $71,400 |
| 2015 | $4,678 | $241,400 | $161,500 | $79,900 |
Source: Public Records
Map
Nearby Homes