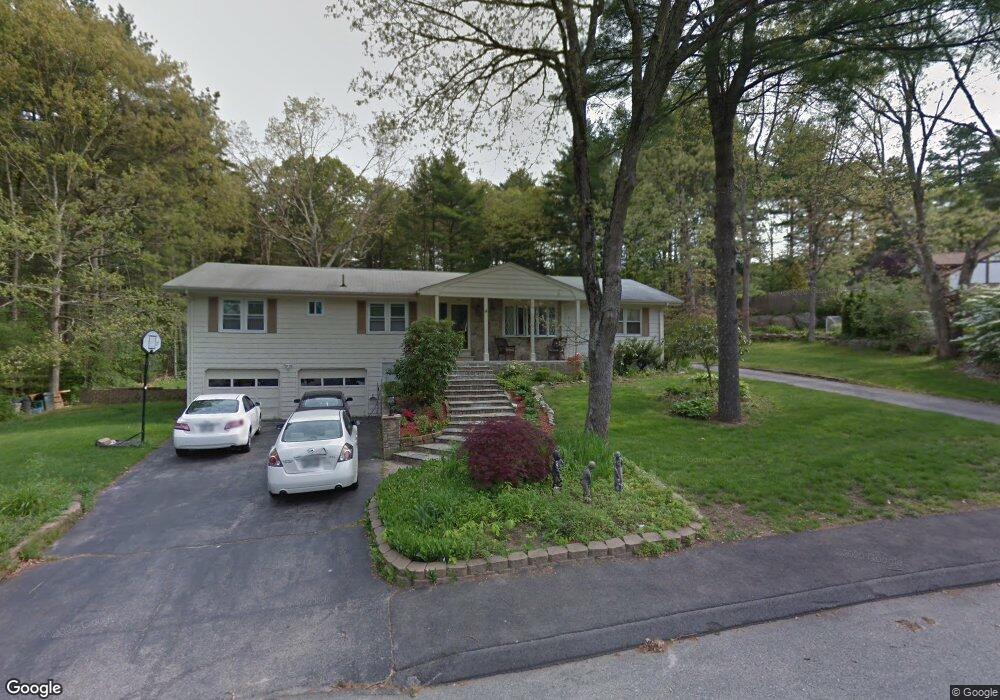
3 Red Maple Rd Coventry, RI 02816
Estimated Value: $575,085 - $623,000
4
Beds
2
Baths
2,704
Sq Ft
$224/Sq Ft
Est. Value
About This Home
This home is located at 3 Red Maple Rd, Coventry, RI 02816 and is currently estimated at $607,021, approximately $224 per square foot. 3 Red Maple Rd is a home located in Kent County with nearby schools including Alan Shawn Feinstein Ms Of Cov, Coventry High School, and Father John V. Doyle School.
Ownership History
Date
Name
Owned For
Owner Type
Purchase Details
Closed on
Oct 31, 2024
Sold by
Calise Marina
Bought by
Calise Melissa and Torborg Skyler
Current Estimated Value
Home Financials for this Owner
Home Financials are based on the most recent Mortgage that was taken out on this home.
Original Mortgage
$385,000
Outstanding Balance
$379,144
Interest Rate
6.09%
Mortgage Type
Purchase Money Mortgage
Estimated Equity
$227,877
Purchase Details
Closed on
Jul 12, 2000
Sold by
Paul Herbert L
Bought by
Calise Marina
Purchase Details
Closed on
May 28, 1996
Sold by
Johnson Andrew J
Bought by
Paul Herbert Lee
Purchase Details
Closed on
Dec 27, 1994
Sold by
Gizienski John J
Bought by
Johnson Andrew J and Johnson Tracey
Create a Home Valuation Report for This Property
The Home Valuation Report is an in-depth analysis detailing your home's value as well as a comparison with similar homes in the area
Purchase History
| Date | Buyer | Sale Price | Title Company |
|---|---|---|---|
| Calise Melissa | $560,000 | -- | |
| Calise Marina | $175,000 | -- | |
| Paul Herbert Lee | $150,000 | -- | |
| Johnson Andrew J | $158,000 | -- |
Source: Public Records
Mortgage History
| Date | Status | Borrower | Loan Amount |
|---|---|---|---|
| Open | Calise Melissa | $385,000 | |
| Previous Owner | Johnson Andrew J | $100,000 | |
| Previous Owner | Johnson Andrew J | $110,000 | |
| Previous Owner | Johnson Andrew J | $16,000 |
Source: Public Records
Tax History
| Year | Tax Paid | Tax Assessment Tax Assessment Total Assessment is a certain percentage of the fair market value that is determined by local assessors to be the total taxable value of land and additions on the property. | Land | Improvement |
|---|---|---|---|---|
| 2025 | $8,804 | $547,200 | $180,000 | $367,200 |
| 2024 | $6,583 | $415,600 | $180,000 | $235,600 |
| 2023 | $6,371 | $415,600 | $180,000 | $235,600 |
| 2022 | $6,376 | $325,800 | $169,700 | $156,100 |
| 2021 | $6,321 | $325,800 | $169,700 | $156,100 |
| 2020 | $7,246 | $325,800 | $169,700 | $156,100 |
| 2019 | $6,089 | $273,800 | $140,100 | $133,700 |
| 2018 | $5,917 | $273,800 | $140,100 | $133,700 |
| 2017 | $5,744 | $273,800 | $140,100 | $133,700 |
| 2016 | $5,209 | $243,300 | $120,300 | $123,000 |
| 2015 | $5,068 | $243,300 | $120,300 | $123,000 |
| 2014 | $4,962 | $243,300 | $120,300 | $123,000 |
| 2013 | $5,105 | $273,600 | $129,300 | $144,300 |
Source: Public Records
Map
Nearby Homes
- 8 Winterberry Dr
- 8 Pine Way Blvd
- 16 Pine Way Blvd
- 5 Circlewood Dr
- 111 Wood Cove Dr
- 4 Leisure Way
- 42 Kiley Way
- 25 Hill Farm Camp Rd
- 40 Leisure Way
- 22 Valiant Dr
- 0 Nooseneck Hill Rd Unit 1404632
- 28 Lane E
- 13 Poppin John Ln
- 8 King Philip Rd
- 49 Wright Way
- 28 Lane D
- 13 Valiant Dr
- 18 Airport Rd
- 10 Lear Dr
- 13 Kelly Ln
Your Personal Tour Guide
Ask me questions while you tour the home.