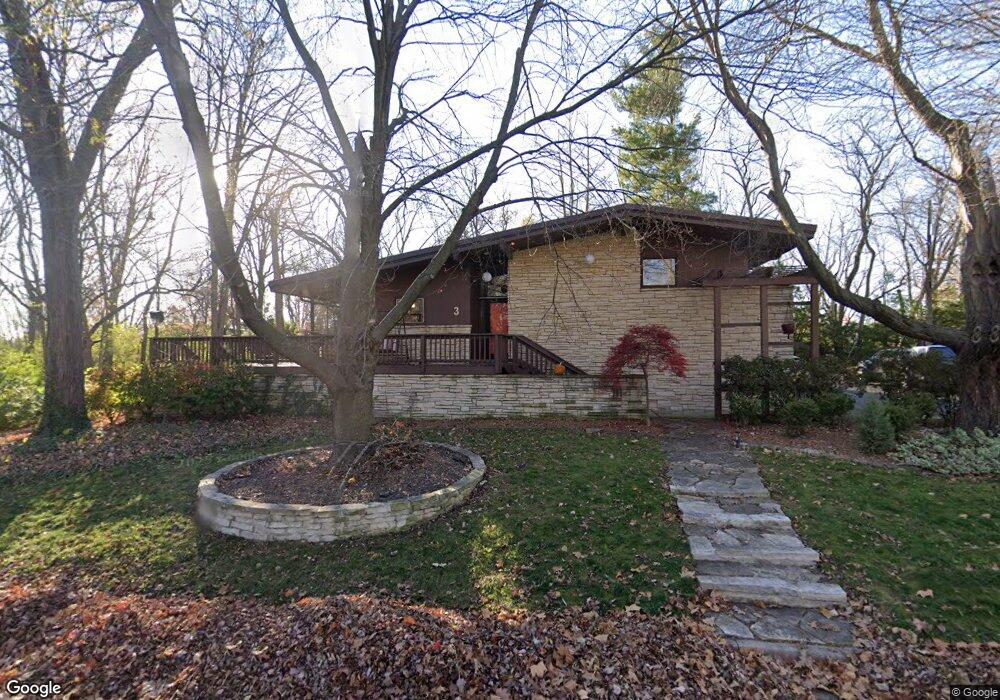
3 Reynolds Ct Normal, IL 61761
Old North Normal NeighborhoodEstimated Value: $264,000 - $324,000
3
Beds
3
Baths
1,725
Sq Ft
$170/Sq Ft
Est. Value
About This Home
This home is located at 3 Reynolds Ct, Normal, IL 61761 and is currently estimated at $294,101, approximately $170 per square foot. 3 Reynolds Ct is a home located in McLean County with nearby schools including Glenn Elementary School, Kingsley Junior High School, and Normal Community West High School.
Ownership History
Date
Name
Owned For
Owner Type
Purchase Details
Closed on
Sep 28, 2022
Sold by
Wilson Daniel Glen
Bought by
Daniel G Wilson Revocable Living Trust and Wilson
Current Estimated Value
Purchase Details
Closed on
Mar 10, 2015
Sold by
Wilson Catherine M
Bought by
Wilson Daniel G
Purchase Details
Closed on
Dec 30, 2014
Sold by
Crow Galen B and Crow Gail L
Bought by
Wilson Daniel G and Wilson Catherine M
Home Financials for this Owner
Home Financials are based on the most recent Mortgage that was taken out on this home.
Original Mortgage
$165,600
Interest Rate
3.84%
Mortgage Type
New Conventional
Purchase Details
Closed on
Feb 4, 2012
Sold by
Crow Galen B and Crow Gail L
Bought by
Crow Galen B and Crow Gail L
Create a Home Valuation Report for This Property
The Home Valuation Report is an in-depth analysis detailing your home's value as well as a comparison with similar homes in the area
Home Values in the Area
Average Home Value in this Area
Purchase History
| Date | Buyer | Sale Price | Title Company |
|---|---|---|---|
| Daniel G Wilson Revocable Living Trust | -- | None Listed On Document | |
| Wilson Daniel G | -- | None Available | |
| Wilson Daniel G | $210,000 | None Available | |
| Crow Galen B | -- | None Available |
Source: Public Records
Mortgage History
| Date | Status | Borrower | Loan Amount |
|---|---|---|---|
| Previous Owner | Wilson Daniel G | $165,600 |
Source: Public Records
Tax History
| Year | Tax Paid | Tax Assessment Tax Assessment Total Assessment is a certain percentage of the fair market value that is determined by local assessors to be the total taxable value of land and additions on the property. | Land | Improvement |
|---|---|---|---|---|
| 2024 | $5,797 | $87,190 | $18,738 | $68,452 |
| 2022 | $5,797 | $70,532 | $15,158 | $55,374 |
| 2021 | $5,568 | $66,546 | $14,301 | $52,245 |
| 2020 | $5,426 | $64,715 | $13,907 | $50,808 |
| 2019 | $5,239 | $64,367 | $13,832 | $50,535 |
| 2018 | $5,176 | $63,686 | $13,686 | $50,000 |
| 2017 | $5,785 | $72,854 | $13,686 | $59,168 |
| 2016 | $5,722 | $72,854 | $13,686 | $59,168 |
| 2015 | $5,555 | $71,146 | $13,365 | $57,781 |
| 2014 | $5,486 | $71,146 | $13,365 | $57,781 |
| 2013 | -- | $71,146 | $13,365 | $57,781 |
Source: Public Records
Map
Nearby Homes
- 413 Grant St
- 8 University Ct
- 903 N Linden St Unit 207
- 903 N Linden St Unit 108
- 903 N Linden St Unit 28
- 307 Belview Ave
- 1204 Timber Ridge Ct
- 411 Orlando Ave
- 416 Orlando Ave
- 206 N Grove St
- 811 W College Ave
- 816 W College Ave
- 605 Pine St Unit 18
- 320 Basswood Ln
- 450 Beechwood Ct
- 109 Suelynn Dr
- 301 Oakdale Ave
- 112 College Park Ct
- 1507 Ensign Dr
- 1703 Sugar Creek Blvd
Your Personal Tour Guide
Ask me questions while you tour the home.