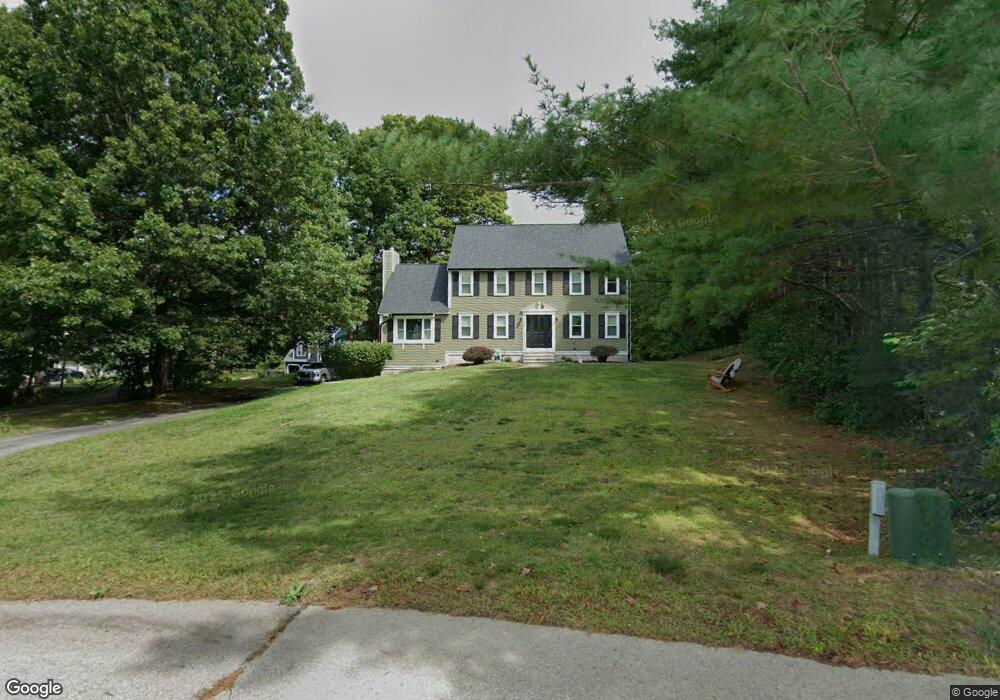
3 Ridge Rd Pepperell, MA 01463
Estimated Value: $635,541 - $672,000
3
Beds
3
Baths
2,409
Sq Ft
$273/Sq Ft
Est. Value
About This Home
This home is located at 3 Ridge Rd, Pepperell, MA 01463 and is currently estimated at $656,885, approximately $272 per square foot. 3 Ridge Rd is a home located in Middlesex County with nearby schools including North Middlesex Regional High School, Pepperell Christian Academy, and 2nd Nature Academy.
Ownership History
Date
Name
Owned For
Owner Type
Purchase Details
Closed on
Jul 7, 2011
Sold by
Herrick Kendall J and Herrick Cathleen F
Bought by
Benson Joshua A and Benson Kirty L
Current Estimated Value
Home Financials for this Owner
Home Financials are based on the most recent Mortgage that was taken out on this home.
Original Mortgage
$302,100
Outstanding Balance
$208,717
Interest Rate
4.6%
Mortgage Type
Purchase Money Mortgage
Estimated Equity
$448,168
Purchase Details
Closed on
Apr 1, 1994
Sold by
Ck Rt
Bought by
Herrick Kendall J and Herrick Cathleen F
Home Financials for this Owner
Home Financials are based on the most recent Mortgage that was taken out on this home.
Original Mortgage
$181,000
Interest Rate
7.07%
Mortgage Type
Purchase Money Mortgage
Create a Home Valuation Report for This Property
The Home Valuation Report is an in-depth analysis detailing your home's value as well as a comparison with similar homes in the area
Home Values in the Area
Average Home Value in this Area
Purchase History
| Date | Buyer | Sale Price | Title Company |
|---|---|---|---|
| Benson Joshua A | $318,000 | -- | |
| Herrick Kendall J | $190,359 | -- |
Source: Public Records
Mortgage History
| Date | Status | Borrower | Loan Amount |
|---|---|---|---|
| Open | Benson Joshua A | $302,100 | |
| Previous Owner | Herrick Kendall J | $181,000 |
Source: Public Records
Tax History
| Year | Tax Paid | Tax Assessment Tax Assessment Total Assessment is a certain percentage of the fair market value that is determined by local assessors to be the total taxable value of land and additions on the property. | Land | Improvement |
|---|---|---|---|---|
| 2025 | $7,720 | $527,700 | $154,700 | $373,000 |
| 2024 | $7,057 | $491,800 | $141,200 | $350,600 |
| 2023 | $6,904 | $456,000 | $127,800 | $328,200 |
| 2022 | $6,893 | $401,900 | $114,300 | $287,600 |
| 2021 | $6,695 | $373,600 | $100,900 | $272,700 |
| 2020 | $12,644 | $378,300 | $100,900 | $277,400 |
| 2019 | $5,773 | $348,000 | $100,900 | $247,100 |
| 2018 | $10,861 | $333,900 | $100,900 | $233,000 |
| 2017 | $2,783 | $321,800 | $100,900 | $220,900 |
| 2016 | $4,990 | $301,900 | $100,900 | $201,000 |
| 2015 | $4,708 | $295,200 | $94,200 | $201,000 |
| 2014 | $4,625 | $291,600 | $94,200 | $197,400 |
Source: Public Records
Map
Nearby Homes
- 147 Nashua Rd
- 77 Birchwood Dr
- 4 Southgate Rd
- 1 Pats Way
- 24 Unkety Brook Way
- 194 Dow Rd
- 6 Testament Cir Unit 5
- 21 Shawn Ave
- 9-48-8 Ladd Ln
- 1 Ladd Ln
- 1 Dalkeith Rd
- 3 Woodbury Dr
- 14 Brookline St
- 4 Spaulding Ln
- 39 Hollis St Unit A
- 38 Tarbell St Unit 5B
- 38 Tarbell St Unit 1D
- 28-30 Groton St
- 29 Tarbell St
- 105 Rideout Rd
Your Personal Tour Guide
Ask me questions while you tour the home.