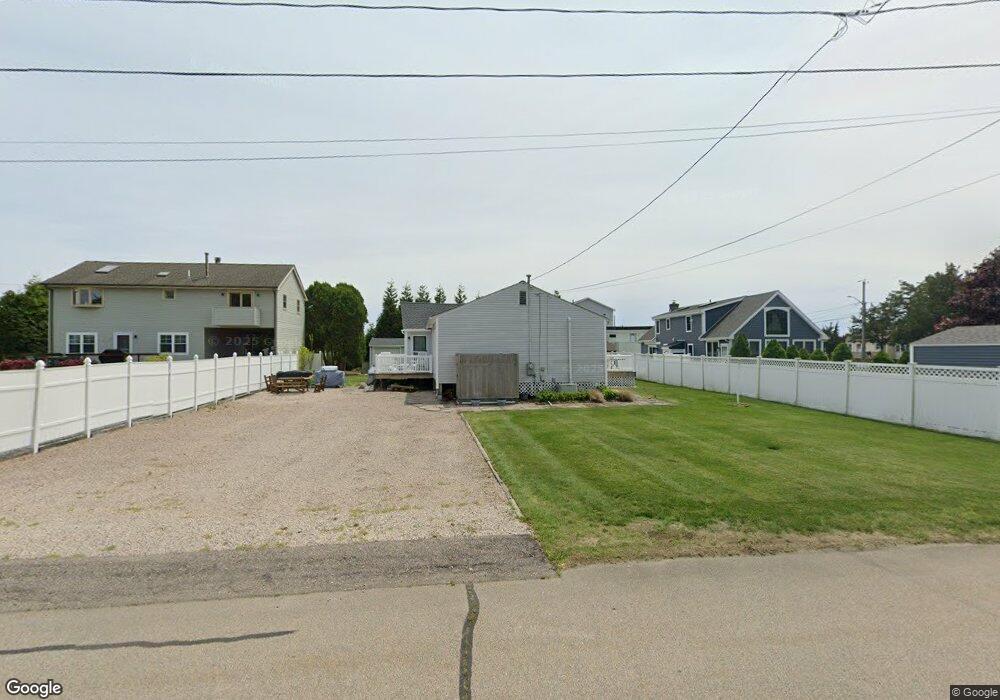
3 Rip Tide Dr Westerly, RI 02891
Estimated Value: $863,000 - $946,000
2
Beds
1
Bath
1,060
Sq Ft
$859/Sq Ft
Est. Value
About This Home
This home is located at 3 Rip Tide Dr, Westerly, RI 02891 and is currently estimated at $910,274, approximately $858 per square foot. 3 Rip Tide Dr is a home with nearby schools including Westerly High School and St. Michael School.
Ownership History
Date
Name
Owned For
Owner Type
Purchase Details
Closed on
Aug 27, 1999
Sold by
A-Mcginty Patricia M
Bought by
Mankus Richard S and Mankus Eileen
Current Estimated Value
Home Financials for this Owner
Home Financials are based on the most recent Mortgage that was taken out on this home.
Original Mortgage
$92,000
Outstanding Balance
$26,190
Interest Rate
7.53%
Mortgage Type
Purchase Money Mortgage
Estimated Equity
$884,084
Create a Home Valuation Report for This Property
The Home Valuation Report is an in-depth analysis detailing your home's value as well as a comparison with similar homes in the area
Home Values in the Area
Average Home Value in this Area
Purchase History
| Date | Buyer | Sale Price | Title Company |
|---|---|---|---|
| Mankus Richard S | $115,000 | -- |
Source: Public Records
Mortgage History
| Date | Status | Borrower | Loan Amount |
|---|---|---|---|
| Open | Mankus Richard S | $92,000 |
Source: Public Records
Tax History
| Year | Tax Paid | Tax Assessment Tax Assessment Total Assessment is a certain percentage of the fair market value that is determined by local assessors to be the total taxable value of land and additions on the property. | Land | Improvement |
|---|---|---|---|---|
| 2025 | $5,861 | $824,300 | $643,300 | $181,000 |
| 2024 | $5,942 | $605,700 | $459,800 | $145,900 |
| 2023 | $5,827 | $605,700 | $459,800 | $145,900 |
| 2022 | $5,790 | $605,700 | $459,800 | $145,900 |
| 2021 | $5,102 | $442,900 | $333,400 | $109,500 |
| 2020 | $5,009 | $442,900 | $333,400 | $109,500 |
| 2019 | $4,960 | $442,900 | $333,400 | $109,500 |
| 2018 | $4,694 | $395,100 | $303,100 | $92,000 |
| 2017 | $4,579 | $395,100 | $303,100 | $92,000 |
| 2016 | $4,615 | $395,100 | $303,100 | $92,000 |
| 2015 | $4,496 | $415,500 | $309,300 | $106,200 |
| 2014 | $4,421 | $415,500 | $309,300 | $106,200 |
Source: Public Records
Map
Nearby Homes
- 27 Benson Ave
- 10 Tristam St
- 9 Compass Way Unit 201
- 9 Compass Way Unit 202
- 9 Compass Way Unit 101
- 9 Compass Way Unit 102
- 9 Compass Way Unit 103
- 9 Compass Way Unit 203
- 4 Shore Rd
- 4 Quail Run
- 432 Atlantic Ave
- 20 Browning Rd
- 446 Atlantic Ave
- 19 Wicklow Rd
- 417 River Rd
- 60 Avondale Rd
- 18 Timothy Dr
- 470 Atlantic Ave
- 9 Champlin Dr
- 54 Sherwood Dr
Your Personal Tour Guide
Ask me questions while you tour the home.