
Seller's Agent in 2025
Kevin Fruh
Gibson Sotheby's International Realty
(978) 500-7409
107 in this area
238 Total Sales

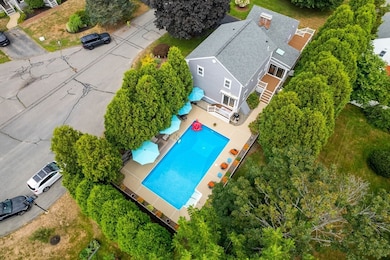
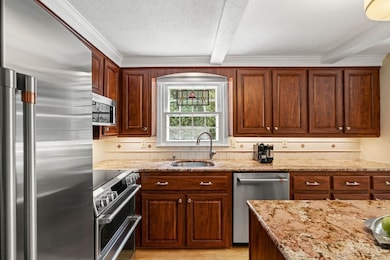
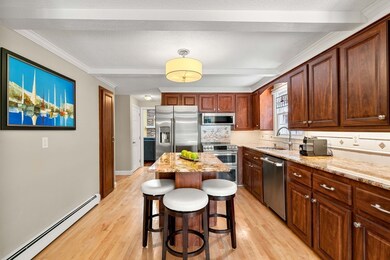
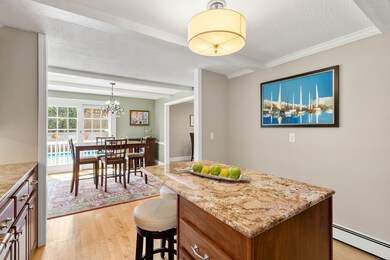
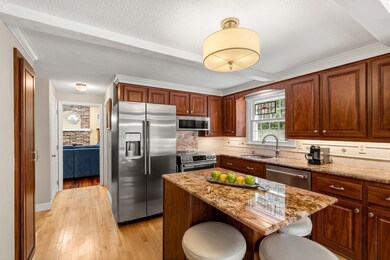
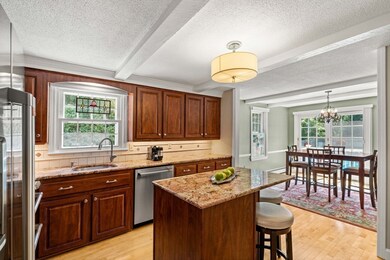
Located in Newburyport's highly desired South End, this elegant Colonial is tucked away on a serene cul-de-sac just seconds from the Merrimack River & Joppa’s treasured coastline. Featuring high quality updates throughout, this home offers resort-style living with a sparkling pool, 3 outdoor composite decks, lush gardens & a sun-filled three-season porch. Inside, an open & airy floor plan showcases hardwood floors, vaulted ceilings, skylights & grand fireplace. The chef’s kitchen boasts granite countertops, newly installed stainless appliances & an island that flows seamlessly to a dining room framed by a French door slider overlooking your private outdoor oasis. Retreat upstairs to the luxurious primary suite with dual closets & spa-inspired bath featuring a double quartz vanity & soaking tub. Two additional bedrooms, updated baths & a finished lower level with wet bar complete this coastal gem—where elegance, comfort, and seaside charm converge. Moments to downtown & Plum Island.
Last Agent to Sell the Property
Gibson Sotheby's International Realty Listed on: 08/20/2025
| Date | Type | Sale Price | Title Company |
|---|---|---|---|
| Quit Claim Deed | $1,500,000 | -- | |
| Quit Claim Deed | -- | None Available | |
| Quit Claim Deed | -- | None Available | |
| Quit Claim Deed | -- | None Available | |
| Quit Claim Deed | -- | None Available | |
| Quit Claim Deed | -- | None Available | |
| Deed | -- | -- | |
| Deed | -- | -- | |
| Deed | -- | -- | |
| Deed | $575,000 | -- | |
| Deed | -- | -- | |
| Deed | -- | -- | |
| Deed | $575,000 | -- |
| Date | Status | Loan Amount | Loan Type |
|---|---|---|---|
| Open | $1,275,000 | Purchase Money Mortgage | |
| Previous Owner | $381,900 | New Conventional | |
| Previous Owner | $389,000 | Stand Alone Second |
| Date | Event | Price | List to Sale | Price per Sq Ft |
|---|---|---|---|---|
| 10/28/2025 10/28/25 | Sold | $1,500,000 | +1.7% | $628 / Sq Ft |
| 08/22/2025 08/22/25 | Pending | -- | -- | -- |
| 08/20/2025 08/20/25 | For Sale | $1,475,000 | -- | $618 / Sq Ft |
| Year | Tax Paid | Tax Assessment Tax Assessment Total Assessment is a certain percentage of the fair market value that is determined by local assessors to be the total taxable value of land and additions on the property. | Land | Improvement |
|---|---|---|---|---|
| 2025 | $8,777 | $916,200 | $481,300 | $434,900 |
| 2024 | $8,482 | $850,800 | $437,500 | $413,300 |
| 2023 | $7,691 | $716,100 | $380,400 | $335,700 |
| 2022 | $7,528 | $626,800 | $317,000 | $309,800 |
| 2021 | $7,306 | $578,000 | $288,200 | $289,800 |
| 2020 | $7,293 | $568,000 | $288,200 | $279,800 |
| 2019 | $7,244 | $553,800 | $288,200 | $265,600 |
| 2018 | $6,886 | $519,300 | $274,600 | $244,700 |
| 2017 | $6,865 | $510,400 | $261,500 | $248,900 |
| 2016 | $6,600 | $492,900 | $249,000 | $243,900 |
| 2015 | $6,575 | $492,900 | $249,000 | $243,900 |
Seller's Agent in 2025
Kevin Fruh
Gibson Sotheby's International Realty
(978) 500-7409
107 in this area
238 Total Sales
R
Seller Co-Listing Agent in 2025
Rachel Mello
Gibson Sotheby's International Realty
50 in this area
105 Total Sales
Buyer's Agent in 2025
Maggie Pratt
Keller Williams Realty Evolution
(978) 270-8315
8 in this area
95 Total Sales
Source: MLS Property Information Network (MLS PIN)
MLS Number: 73420031
APN: NEWP-000031-000017-J000000
Disclaimer: Certain information contained herein is derived from information provided by parties other than Homes.com. All information provided is deemed reliable, but is not guaranteed to be accurate and should be independently verified.
![]() The property listing data and information, or the Images, set forth herein were provided to MLS Property Information Network, Inc. from third party sources, including sellers, lessors and public records, and were compiled by MLS Property Information Network, Inc. The property listing data and information, and the Images, are for the personal, non-commercial use of consumers having a good faith interest in purchasing or leasing listed properties of the type displayed to them and may not be used for any purpose other than to identify prospective properties which such consumers may have a good faith interest in purchasing or leasing. MLS Property Information Network, Inc. and its subscribers disclaim any and all representations and warranties as to the accuracy of the property listing data and information, or as to the accuracy of any of the Images, set forth herein.
The property listing data and information, or the Images, set forth herein were provided to MLS Property Information Network, Inc. from third party sources, including sellers, lessors and public records, and were compiled by MLS Property Information Network, Inc. The property listing data and information, and the Images, are for the personal, non-commercial use of consumers having a good faith interest in purchasing or leasing listed properties of the type displayed to them and may not be used for any purpose other than to identify prospective properties which such consumers may have a good faith interest in purchasing or leasing. MLS Property Information Network, Inc. and its subscribers disclaim any and all representations and warranties as to the accuracy of the property listing data and information, or as to the accuracy of any of the Images, set forth herein.