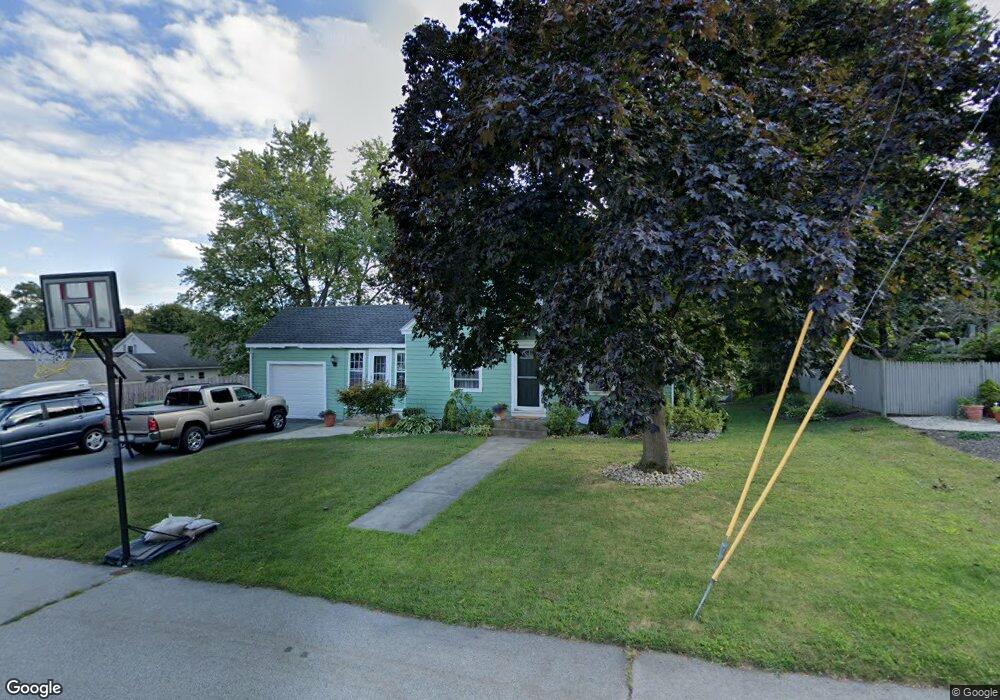
3 Riverview St Nashua, NH 03064
North End Nashua NeighborhoodEstimated Value: $535,277 - $560,000
3
Beds
2
Baths
1,639
Sq Ft
$331/Sq Ft
Est. Value
About This Home
This home is located at 3 Riverview St, Nashua, NH 03064 and is currently estimated at $542,819, approximately $331 per square foot. 3 Riverview St is a home located in Hillsborough County with nearby schools including Mount Pleasant Elementary School, Pennichuck Middle School, and Nashua High School North.
Ownership History
Date
Name
Owned For
Owner Type
Purchase Details
Closed on
Feb 6, 2006
Sold by
Naquin James and Naquin Kim
Bought by
Divernieri Christian J and Divernieri Christina N
Current Estimated Value
Home Financials for this Owner
Home Financials are based on the most recent Mortgage that was taken out on this home.
Original Mortgage
$251,500
Interest Rate
6.31%
Mortgage Type
Purchase Money Mortgage
Purchase Details
Closed on
Dec 7, 1999
Sold by
Chabot Amy E
Bought by
Naquin James and Naquin Kim
Home Financials for this Owner
Home Financials are based on the most recent Mortgage that was taken out on this home.
Original Mortgage
$145,000
Interest Rate
7.86%
Mortgage Type
Purchase Money Mortgage
Purchase Details
Closed on
Sep 18, 1996
Sold by
Nutting Est Mary M
Bought by
Hapgood John H and Hapgood Diana L
Home Financials for this Owner
Home Financials are based on the most recent Mortgage that was taken out on this home.
Original Mortgage
$72,000
Interest Rate
7.89%
Mortgage Type
Purchase Money Mortgage
Create a Home Valuation Report for This Property
The Home Valuation Report is an in-depth analysis detailing your home's value as well as a comparison with similar homes in the area
Home Values in the Area
Average Home Value in this Area
Purchase History
| Date | Buyer | Sale Price | Title Company |
|---|---|---|---|
| Divernieri Christian J | $314,400 | -- | |
| Naquin James | $155,000 | -- | |
| Hapgood John H | $90,000 | -- |
Source: Public Records
Mortgage History
| Date | Status | Borrower | Loan Amount |
|---|---|---|---|
| Open | Hapgood John H | $227,000 | |
| Closed | Hapgood John H | $251,500 | |
| Previous Owner | Hapgood John H | $145,000 | |
| Previous Owner | Hapgood John H | $72,000 |
Source: Public Records
Tax History
| Year | Tax Paid | Tax Assessment Tax Assessment Total Assessment is a certain percentage of the fair market value that is determined by local assessors to be the total taxable value of land and additions on the property. | Land | Improvement |
|---|---|---|---|---|
| 2025 | $8,200 | $487,200 | $164,400 | $322,800 |
| 2024 | $7,746 | $487,200 | $164,400 | $322,800 |
| 2023 | $7,288 | $399,800 | $131,600 | $268,200 |
| 2022 | $7,224 | $399,800 | $131,600 | $268,200 |
| 2021 | $6,444 | $277,500 | $91,600 | $185,900 |
| 2020 | $6,274 | $277,500 | $91,600 | $185,900 |
| 2019 | $6,038 | $277,500 | $91,600 | $185,900 |
| 2018 | $5,886 | $277,500 | $91,600 | $185,900 |
| 2017 | $5,651 | $219,100 | $87,400 | $131,700 |
| 2016 | $5,493 | $219,100 | $87,400 | $131,700 |
| 2015 | $5,375 | $219,100 | $87,400 | $131,700 |
| 2014 | $5,269 | $219,100 | $87,400 | $131,700 |
Source: Public Records
Map
Nearby Homes
- 151 Tolles St Unit 244
- 46 Perham St Unit 214
- 23-25 Salem St
- 32 Norton St
- 106 Lock St
- 79 Walden Pond Dr
- 36 Courtland St Unit 38
- 19 Cross St
- 70 Concord St
- 79 Concord St
- 40 Walden Pond Dr
- 5 Merrimack St
- 16 Walden Pond Dr
- 11 Amory St
- 4 Reservoir St
- 14 Artillery Ln Unit A
- 19 Bartlett Ave
- 9-11 Mason St
- 213 Abbott Farm Ln
- 11 Juliana Ave Unit 52
Your Personal Tour Guide
Ask me questions while you tour the home.