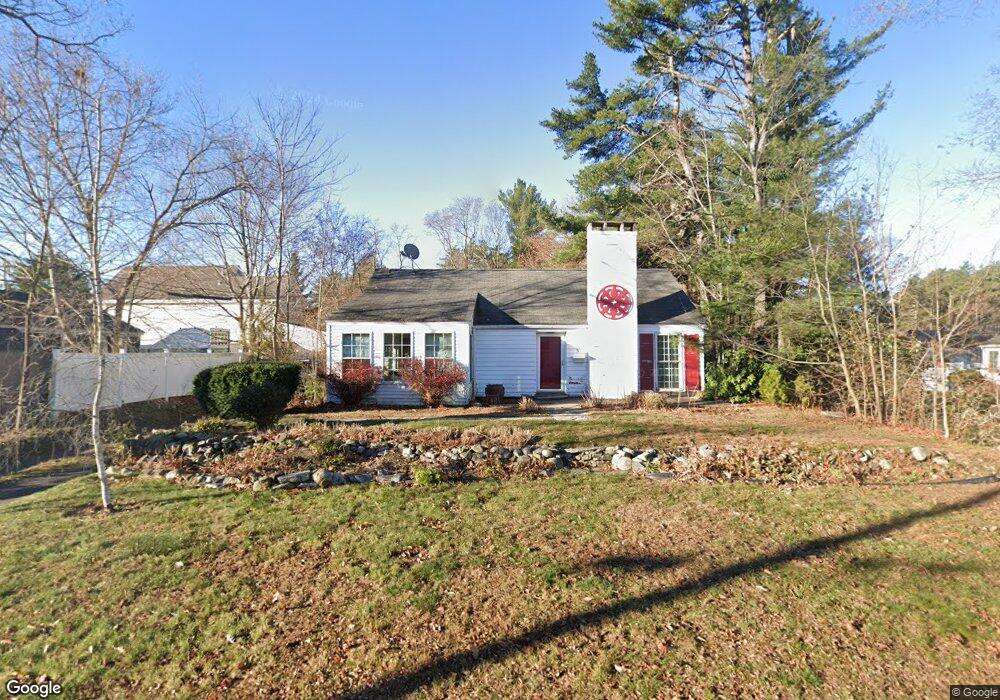
3 Roberts St Biddeford, ME 04005
Estimated Value: $356,000 - $422,000
2
Beds
1
Bath
1,694
Sq Ft
$230/Sq Ft
Est. Value
About This Home
This home is located at 3 Roberts St, Biddeford, ME 04005 and is currently estimated at $389,522, approximately $229 per square foot. 3 Roberts St is a home located in York County with nearby schools including John F Kennedy Memorial School, Biddeford Primary School, and Biddeford Intermediate School.
Ownership History
Date
Name
Owned For
Owner Type
Purchase Details
Closed on
Apr 3, 2012
Sold by
Plante Roger L
Bought by
Popken Lilianne D and Popken Karl M
Current Estimated Value
Home Financials for this Owner
Home Financials are based on the most recent Mortgage that was taken out on this home.
Original Mortgage
$88,904
Outstanding Balance
$61,320
Interest Rate
3.88%
Mortgage Type
Purchase Money Mortgage
Estimated Equity
$328,202
Create a Home Valuation Report for This Property
The Home Valuation Report is an in-depth analysis detailing your home's value as well as a comparison with similar homes in the area
Home Values in the Area
Average Home Value in this Area
Purchase History
| Date | Buyer | Sale Price | Title Company |
|---|---|---|---|
| Popken Lilianne D | -- | -- |
Source: Public Records
Mortgage History
| Date | Status | Borrower | Loan Amount |
|---|---|---|---|
| Open | Popken Lilianne D | $88,904 |
Source: Public Records
Tax History Compared to Growth
Tax History
| Year | Tax Paid | Tax Assessment Tax Assessment Total Assessment is a certain percentage of the fair market value that is determined by local assessors to be the total taxable value of land and additions on the property. | Land | Improvement |
|---|---|---|---|---|
| 2024 | $3,436 | $241,600 | $133,000 | $108,600 |
| 2023 | $3,137 | $239,100 | $130,500 | $108,600 |
| 2022 | $2,967 | $180,800 | $76,100 | $104,700 |
| 2021 | $2,348 | $153,800 | $64,400 | $89,400 |
| 2020 | $2,332 | $140,800 | $58,500 | $82,300 |
| 2019 | $2,813 | $140,800 | $58,500 | $82,300 |
| 2018 | $2,774 | $140,800 | $58,500 | $82,300 |
| 2017 | $5,525 | $130,100 | $58,500 | $71,600 |
| 2016 | $2,584 | $130,100 | $58,500 | $71,600 |
| 2015 | $2,338 | $130,100 | $58,500 | $71,600 |
| 2014 | $2,281 | $130,100 | $58,500 | $71,600 |
| 2013 | -- | $150,400 | $57,400 | $93,000 |
Source: Public Records
Map
Nearby Homes