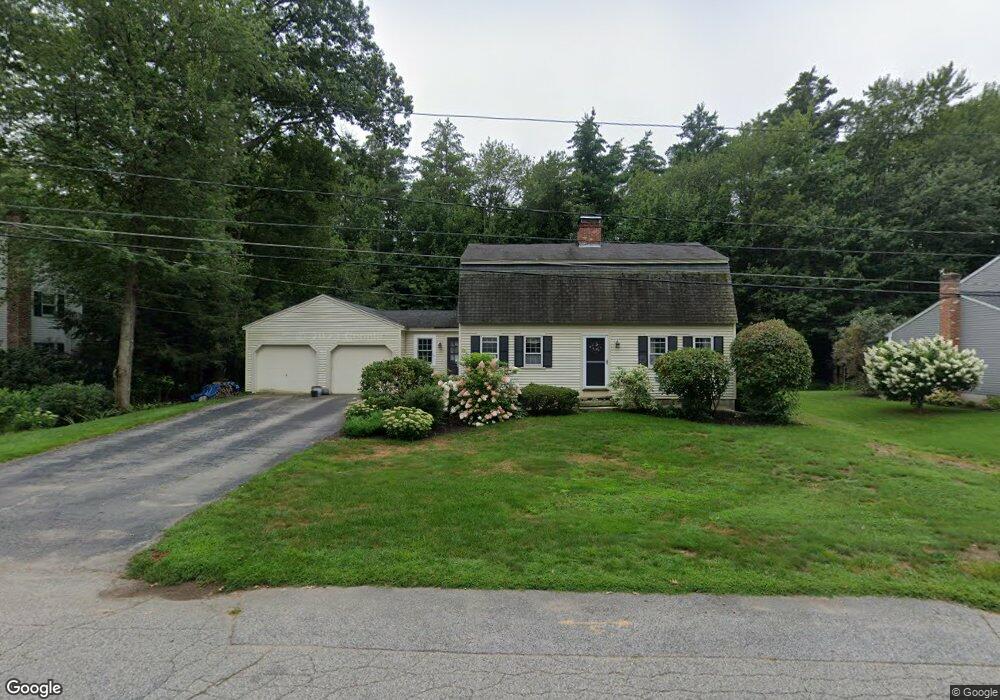
3 Rolinda Ave Concord, NH 03301
South End NeighborhoodEstimated Value: $606,681 - $720,000
4
Beds
2
Baths
2,088
Sq Ft
$324/Sq Ft
Est. Value
About This Home
This home is located at 3 Rolinda Ave, Concord, NH 03301 and is currently estimated at $675,920, approximately $323 per square foot. 3 Rolinda Ave is a home located in Merrimack County with nearby schools including Abbot-Downing School, Rundlett Middle School, and Concord High School.
Ownership History
Date
Name
Owned For
Owner Type
Purchase Details
Closed on
Feb 17, 1999
Sold by
Quinn Thomas P and Quinn Joyce A
Bought by
Baroody Philip C and Baroody Lia M
Current Estimated Value
Home Financials for this Owner
Home Financials are based on the most recent Mortgage that was taken out on this home.
Original Mortgage
$142,400
Interest Rate
6.75%
Mortgage Type
Purchase Money Mortgage
Create a Home Valuation Report for This Property
The Home Valuation Report is an in-depth analysis detailing your home's value as well as a comparison with similar homes in the area
Home Values in the Area
Average Home Value in this Area
Purchase History
| Date | Buyer | Sale Price | Title Company |
|---|---|---|---|
| Baroody Philip C | $178,000 | -- |
Source: Public Records
Mortgage History
| Date | Status | Borrower | Loan Amount |
|---|---|---|---|
| Open | Baroody Philip C | $184,875 | |
| Closed | Baroody Philip C | $80,000 | |
| Closed | Baroody Philip C | $142,400 |
Source: Public Records
Tax History Compared to Growth
Tax History
| Year | Tax Paid | Tax Assessment Tax Assessment Total Assessment is a certain percentage of the fair market value that is determined by local assessors to be the total taxable value of land and additions on the property. | Land | Improvement |
|---|---|---|---|---|
| 2024 | $11,256 | $406,500 | $131,900 | $274,600 |
| 2023 | $10,919 | $406,500 | $131,900 | $274,600 |
| 2022 | $10,524 | $406,500 | $131,900 | $274,600 |
| 2021 | $10,211 | $406,500 | $131,900 | $274,600 |
| 2020 | $10,008 | $374,000 | $103,900 | $270,100 |
| 2019 | $9,623 | $346,400 | $108,000 | $238,400 |
| 2018 | $9,353 | $331,800 | $108,300 | $223,500 |
| 2017 | $9,172 | $324,800 | $108,300 | $216,500 |
| 2016 | $8,708 | $314,700 | $106,200 | $208,500 |
| 2015 | $8,243 | $296,800 | $115,300 | $181,500 |
| 2014 | $7,957 | $296,800 | $115,300 | $181,500 |
| 2013 | -- | $296,800 | $115,300 | $181,500 |
| 2012 | -- | $295,300 | $121,400 | $173,900 |
Source: Public Records
Map
Nearby Homes