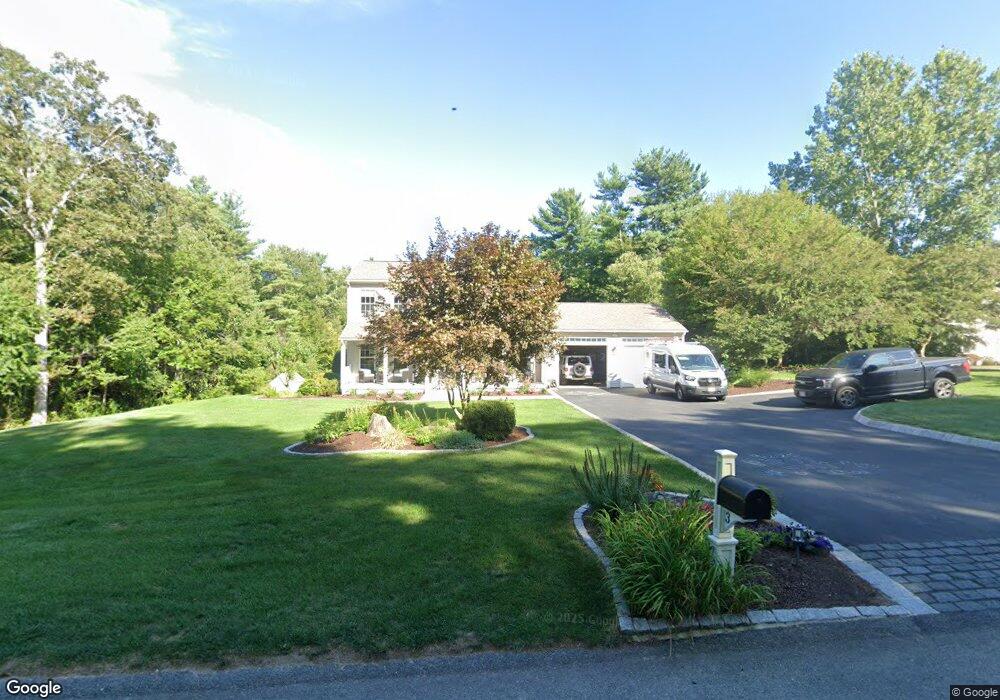
3 Ross Cir Assonet, MA 02702
Estimated Value: $592,000 - $681,000
3
Beds
3
Baths
1,896
Sq Ft
$343/Sq Ft
Est. Value
About This Home
This home is located at 3 Ross Cir, Assonet, MA 02702 and is currently estimated at $649,858, approximately $342 per square foot. 3 Ross Cir is a home located in Bristol County with nearby schools including Freetown Elementary School, George R Austin Intermediate School, and Freetown-Lakeville Middle School.
Ownership History
Date
Name
Owned For
Owner Type
Purchase Details
Closed on
Mar 4, 2025
Sold by
Mclaughlin Jeffrey S and Mello Lisa A
Bought by
S J
Current Estimated Value
Purchase Details
Closed on
May 6, 2004
Sold by
Cardoso Fernando
Bought by
Mclaughlin Jeffrey S and Mello Lisa A
Home Financials for this Owner
Home Financials are based on the most recent Mortgage that was taken out on this home.
Original Mortgage
$333,300
Interest Rate
5.39%
Mortgage Type
Purchase Money Mortgage
Create a Home Valuation Report for This Property
The Home Valuation Report is an in-depth analysis detailing your home's value as well as a comparison with similar homes in the area
Home Values in the Area
Average Home Value in this Area
Purchase History
| Date | Buyer | Sale Price | Title Company |
|---|---|---|---|
| S J | -- | None Available | |
| S J | -- | None Available | |
| Mclaughlin Jeffrey S | $205,000 | -- | |
| Mclaughlin Jeffrey S | $205,000 | -- |
Source: Public Records
Mortgage History
| Date | Status | Borrower | Loan Amount |
|---|---|---|---|
| Previous Owner | Mclaughlin Jeffrey S | $301,000 | |
| Previous Owner | Mclaughlin Jeffrey S | $338,843 | |
| Previous Owner | Mclaughlin Jeffrey S | $333,300 |
Source: Public Records
Tax History Compared to Growth
Tax History
| Year | Tax Paid | Tax Assessment Tax Assessment Total Assessment is a certain percentage of the fair market value that is determined by local assessors to be the total taxable value of land and additions on the property. | Land | Improvement |
|---|---|---|---|---|
| 2025 | $5,645 | $569,600 | $211,000 | $358,600 |
| 2024 | $5,651 | $541,800 | $199,000 | $342,800 |
| 2023 | $5,530 | $516,300 | $179,200 | $337,100 |
| 2022 | $5,310 | $440,300 | $151,800 | $288,500 |
| 2021 | $5,131 | $404,000 | $138,000 | $266,000 |
| 2020 | $5,110 | $392,500 | $132,700 | $259,800 |
| 2019 | $4,935 | $375,300 | $132,000 | $243,300 |
| 2018 | $4,689 | $352,300 | $132,000 | $220,300 |
| 2017 | $4,589 | $344,500 | $132,000 | $212,500 |
| 2016 | $4,377 | $334,400 | $128,200 | $206,200 |
| 2015 | $4,221 | $327,200 | $122,700 | $204,500 |
| 2014 | $4,140 | $328,300 | $125,600 | $202,700 |
Source: Public Records
Map
Nearby Homes