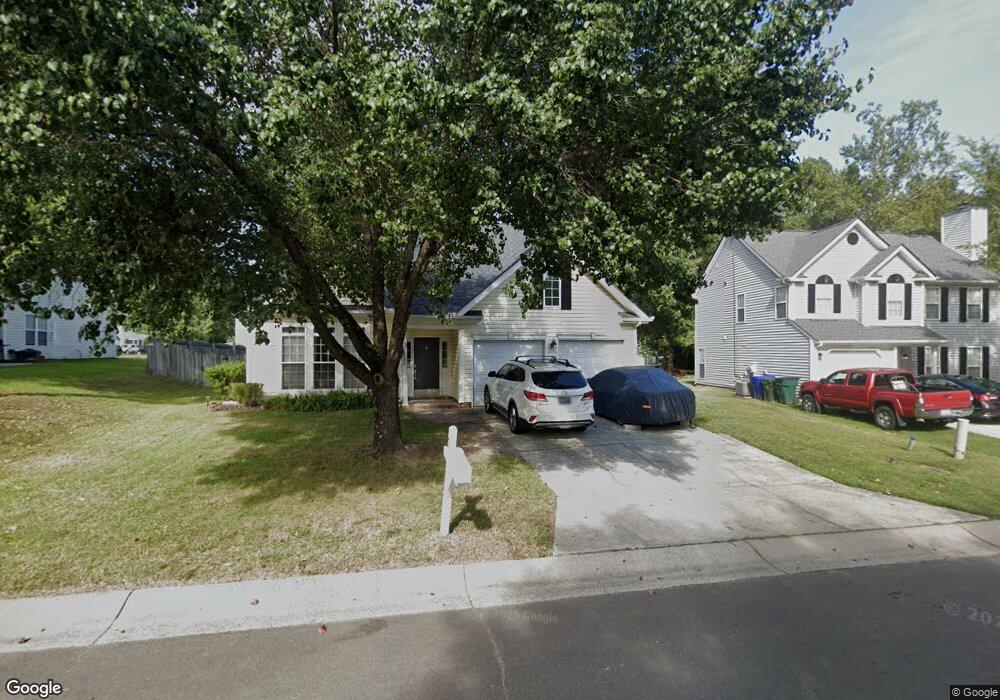
3 S Berrymeadow Ln Durham, NC 27703
Eastern Durham NeighborhoodEstimated Value: $353,459 - $383,000
3
Beds
3
Baths
2,023
Sq Ft
$181/Sq Ft
Est. Value
About This Home
This home is located at 3 S Berrymeadow Ln, Durham, NC 27703 and is currently estimated at $366,865, approximately $181 per square foot. 3 S Berrymeadow Ln is a home located in Durham County with nearby schools including Glenn Elementary, John W Neal Middle School, and Southern School of Energy & Sustainability.
Ownership History
Date
Name
Owned For
Owner Type
Purchase Details
Closed on
Apr 9, 2015
Sold by
Jacobs Sandon L
Bought by
Jacobs Sandon L Jacobs Brandi K
Current Estimated Value
Purchase Details
Closed on
Nov 1, 2001
Sold by
Moyle Shawn R and Moyle Natalie G
Bought by
Jacobs Sandon L and Jacobs Brandi K
Home Financials for this Owner
Home Financials are based on the most recent Mortgage that was taken out on this home.
Original Mortgage
$138,000
Interest Rate
6.74%
Purchase Details
Closed on
Mar 14, 2000
Sold by
Cimarron Capital Inc
Bought by
Moyle Shawn R and Moyle Natalie G
Home Financials for this Owner
Home Financials are based on the most recent Mortgage that was taken out on this home.
Original Mortgage
$158,068
Interest Rate
8.24%
Mortgage Type
FHA
Create a Home Valuation Report for This Property
The Home Valuation Report is an in-depth analysis detailing your home's value as well as a comparison with similar homes in the area
Home Values in the Area
Average Home Value in this Area
Purchase History
| Date | Buyer | Sale Price | Title Company |
|---|---|---|---|
| Jacobs Sandon L Jacobs Brandi K | $161,000 | -- | |
| Jacobs Sandon L | $172,500 | -- | |
| Moyle Shawn R | $160,500 | -- |
Source: Public Records
Mortgage History
| Date | Status | Borrower | Loan Amount |
|---|---|---|---|
| Previous Owner | Jacobs Sandon L | $138,000 | |
| Previous Owner | Moyle Shawn R | $158,068 | |
| Closed | Jacobs Sandon L | $25,875 |
Source: Public Records
Tax History Compared to Growth
Tax History
| Year | Tax Paid | Tax Assessment Tax Assessment Total Assessment is a certain percentage of the fair market value that is determined by local assessors to be the total taxable value of land and additions on the property. | Land | Improvement |
|---|---|---|---|---|
| 2025 | $3,809 | $384,196 | $57,195 | $327,001 |
| 2024 | $2,859 | $204,975 | $24,640 | $180,335 |
| 2023 | $2,685 | $204,975 | $24,640 | $180,335 |
| 2022 | $2,623 | $204,975 | $24,640 | $180,335 |
| 2021 | $2,611 | $204,975 | $24,640 | $180,335 |
| 2020 | $2,550 | $204,975 | $24,640 | $180,335 |
| 2019 | $2,550 | $204,975 | $24,640 | $180,335 |
| 2018 | $2,256 | $166,316 | $24,640 | $141,676 |
| 2017 | $2,239 | $166,316 | $24,640 | $141,676 |
| 2016 | $2,164 | $166,316 | $24,640 | $141,676 |
| 2015 | $2,391 | $172,726 | $28,925 | $143,801 |
| 2014 | $2,391 | $172,726 | $28,925 | $143,801 |
Source: Public Records
Map
Nearby Homes
- 5609 Thistlerock Ln
- 4 N Berrymeadow Ln
- 4 Fire Rock Place
- 31 S Angela Cir
- 4807 Tyne Dr
- 5409 Hadrian Dr
- 2 Tarrywood Ct
- 214 Cloverdale Dr
- 3801 Tyne Dr
- 103 Bermuda Green Dr
- 59 Enesco Cir
- 1 Thorn Brook Ct
- 612 Chivalry Dr
- 10 Autrey Mill Cir
- 106 Newberry Ln
- 416 Chivalry Dr
- 110 Kindlewood Dr
- 1038 Statler Dr
- 110 Knightwood Dr
- 521 Quartz Dr
- 5708 Thistlerock Ln
- 5 S Berrymeadow Ln
- 5710 Thistlerock Ln
- 4 S Berrymeadow Ln
- 7 S Berrymeadow Ln
- 5712 Thistlerock Ln
- 5706 Thistlerock Ln
- 2 N Berrymeadow Ln
- 6 S Berrymeadow Ln
- 9 S Berrymeadow Ln
- 5714 Thistlerock Ln
- 5711 Thistlerock Ln
- 1 N Berrymeadow Ln
- 5700 Thistlerock Ln
- 5715 Thistlerock Ln
- 5713 Thistlerock Ln
- 3 Perigrine Way
- 8 S Berrymeadow Ln
- 5802 Thistlerock Ln
- 5717 Thistlerock Ln