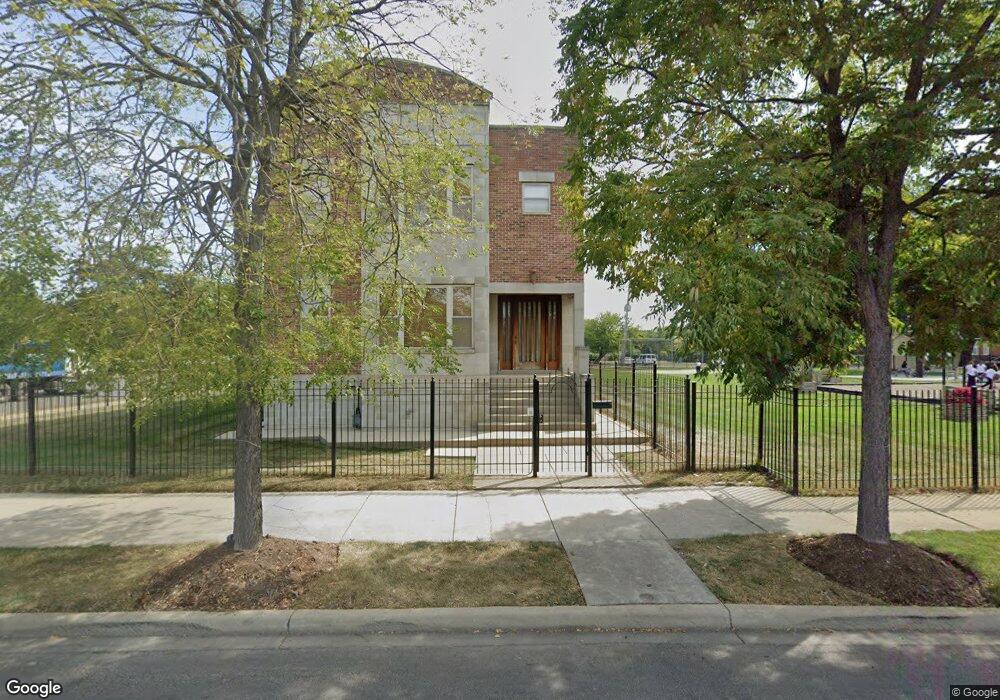
3 S Central Park Blvd Chicago, IL 60624
Garfield Park NeighborhoodEstimated Value: $541,000 - $806,000
4
Beds
6
Baths
3,458
Sq Ft
$193/Sq Ft
Est. Value
About This Home
This home is located at 3 S Central Park Blvd, Chicago, IL 60624 and is currently estimated at $666,155, approximately $192 per square foot. 3 S Central Park Blvd is a home located in Cook County with nearby schools including Faraday Elementary School, Marshall Metropolitan High School, and Providence St. Mel School.
Ownership History
Date
Name
Owned For
Owner Type
Purchase Details
Closed on
Jun 17, 2008
Sold by
New Vision Development Corp
Bought by
Smith Ed H and Smith Carolyn A
Current Estimated Value
Home Financials for this Owner
Home Financials are based on the most recent Mortgage that was taken out on this home.
Original Mortgage
$417,000
Outstanding Balance
$268,270
Interest Rate
6.1%
Mortgage Type
Purchase Money Mortgage
Estimated Equity
$397,885
Purchase Details
Closed on
Aug 31, 2006
Sold by
The City Of Chicago
Bought by
New Vision Development Corp
Purchase Details
Closed on
Jul 6, 2001
Sold by
Orr David D
Bought by
City Of Chicago
Purchase Details
Closed on
Jun 15, 2001
Sold by
Temple Henderson
Bought by
City Of Chicago
Purchase Details
Closed on
May 13, 1997
Sold by
Oakley Investments Inc
Bought by
Henderson Temple Cogic Independent Corp
Purchase Details
Closed on
Oct 5, 1994
Sold by
American National Bk & Tr Co Of Chicago
Bought by
Oakley Investments Inc
Create a Home Valuation Report for This Property
The Home Valuation Report is an in-depth analysis detailing your home's value as well as a comparison with similar homes in the area
Home Values in the Area
Average Home Value in this Area
Purchase History
| Date | Buyer | Sale Price | Title Company |
|---|---|---|---|
| Smith Ed H | $580,000 | Executive Land Title | |
| New Vision Development Corp | -- | None Available | |
| City Of Chicago | -- | -- | |
| City Of Chicago | -- | -- | |
| Henderson Temple Cogic Independent Corp | -- | -- | |
| Oakley Investments Inc | -- | -- |
Source: Public Records
Mortgage History
| Date | Status | Borrower | Loan Amount |
|---|---|---|---|
| Open | Smith Ed H | $417,000 |
Source: Public Records
Tax History Compared to Growth
Tax History
| Year | Tax Paid | Tax Assessment Tax Assessment Total Assessment is a certain percentage of the fair market value that is determined by local assessors to be the total taxable value of land and additions on the property. | Land | Improvement |
|---|---|---|---|---|
| 2024 | $8,190 | $51,000 | $20,013 | $30,987 |
| 2023 | $7,962 | $42,000 | $16,217 | $25,783 |
| 2022 | $7,962 | $42,000 | $16,217 | $25,783 |
| 2021 | $7,801 | $41,999 | $16,217 | $25,782 |
| 2020 | $6,518 | $32,265 | $16,217 | $16,048 |
| 2019 | $6,535 | $35,850 | $16,217 | $19,633 |
| 2018 | $6,424 | $35,850 | $16,217 | $19,633 |
| 2017 | $7,174 | $36,588 | $14,492 | $22,096 |
| 2016 | $6,471 | $36,588 | $14,492 | $22,096 |
| 2015 | $6,224 | $36,588 | $14,492 | $22,096 |
| 2014 | $5,247 | $30,847 | $13,802 | $17,045 |
| 2013 | $5,132 | $30,847 | $13,802 | $17,045 |
Source: Public Records
Map
Nearby Homes
- 3508 W Jackson Blvd
- 4408 W Monroe St
- 4008 W Monroe St
- 3328 W Warren Blvd
- 3808 W Washington Blvd Unit E1
- 108 N Hamlin Ave
- 3502 W Lake St
- 3320 W Monroe St
- 3455 W Walnut St
- 3530 W Van Buren St
- 3334 W Warren Blvd
- 3316 W Maypole Ave
- 3351 W Walnut St
- 3235 W Warren Blvd Unit 2
- 3534 W Fulton Blvd
- 4210 W Washington Blvd
- 3906 W Monroe St
- 3831 W Jackson Blvd
- 3849 W Maypole Ave
- 328 S Spaulding Ave
- 3542 W Monroe St
- 3532 W Monroe St Unit 1
- 3528 W Monroe St
- 3536 W Monroe St Unit 3W
- 3536 W Monroe St Unit 3E
- 3536 W Monroe St Unit 2W
- 3536 W Monroe St Unit 2E
- 3536 W Monroe St Unit 1W
- 3536 W Monroe St Unit 1E
- 3513 W Madison St
- 3524 W Monroe St
- 3522 W Monroe St
- 3516 W Monroe St
- 3516 W Monroe St
- 3538 W Monroe St Unit 2W
- 3538 W Monroe St Unit 1W
- 3538 W Monroe St Unit 3W
- 3512 W Monroe St
- 2822 W Monroe St
- 3529 W Monroe St