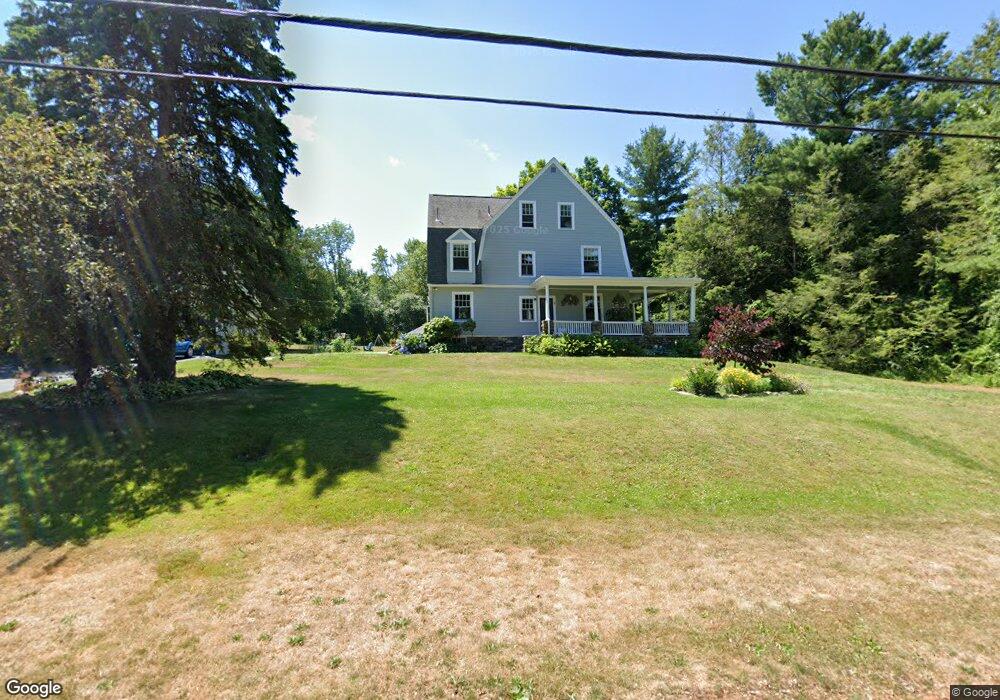
3 Sassamon Rd Natick, MA 01760
Estimated Value: $1,288,000 - $1,510,000
5
Beds
4
Baths
3,058
Sq Ft
$463/Sq Ft
Est. Value
About This Home
This home is located at 3 Sassamon Rd, Natick, MA 01760 and is currently estimated at $1,416,742, approximately $463 per square foot. 3 Sassamon Rd is a home located in Middlesex County with nearby schools including Natick High School, Memorial Elementary School, and J F Kennedy Middle School.
Ownership History
Date
Name
Owned For
Owner Type
Purchase Details
Closed on
Jun 2, 2010
Sold by
Seymour William E and Driscoll Rosemary L
Bought by
Frey Daniel D and Frey Victoria L
Current Estimated Value
Home Financials for this Owner
Home Financials are based on the most recent Mortgage that was taken out on this home.
Original Mortgage
$258,600
Outstanding Balance
$174,585
Interest Rate
5.12%
Mortgage Type
Purchase Money Mortgage
Estimated Equity
$1,242,157
Create a Home Valuation Report for This Property
The Home Valuation Report is an in-depth analysis detailing your home's value as well as a comparison with similar homes in the area
Home Values in the Area
Average Home Value in this Area
Purchase History
| Date | Buyer | Sale Price | Title Company |
|---|---|---|---|
| Frey Daniel D | $646,500 | -- |
Source: Public Records
Mortgage History
| Date | Status | Borrower | Loan Amount |
|---|---|---|---|
| Open | Frey Daniel D | $258,600 |
Source: Public Records
Tax History
| Year | Tax Paid | Tax Assessment Tax Assessment Total Assessment is a certain percentage of the fair market value that is determined by local assessors to be the total taxable value of land and additions on the property. | Land | Improvement |
|---|---|---|---|---|
| 2025 | $13,395 | $1,120,000 | $546,500 | $573,500 |
| 2024 | $12,966 | $1,057,600 | $517,600 | $540,000 |
| 2023 | $12,361 | $977,900 | $476,800 | $501,100 |
| 2022 | $11,797 | $884,300 | $425,700 | $458,600 |
| 2021 | $11,353 | $834,200 | $403,300 | $430,900 |
| 2020 | $10,378 | $762,500 | $386,400 | $376,100 |
| 2019 | $9,691 | $762,500 | $386,400 | $376,100 |
| 2018 | $9,581 | $734,200 | $369,600 | $364,600 |
| 2017 | $9,806 | $726,900 | $368,800 | $358,100 |
| 2016 | $9,815 | $723,300 | $368,800 | $354,500 |
| 2015 | $9,537 | $690,100 | $368,800 | $321,300 |
Source: Public Records
Map
Nearby Homes
Your Personal Tour Guide
Ask me questions while you tour the home.