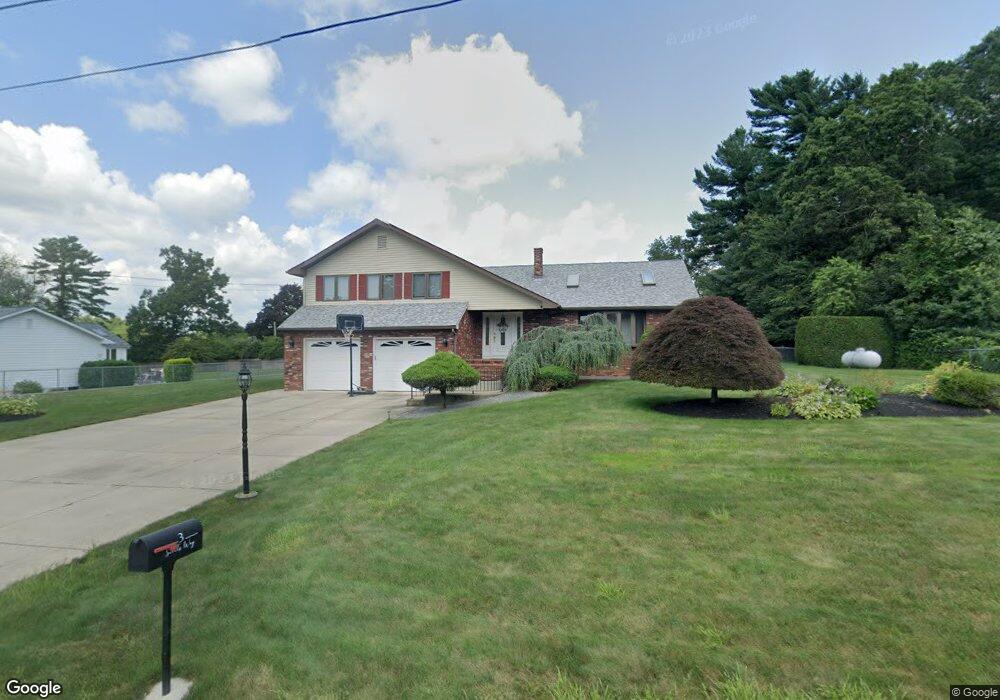
3 Scotts Way Acushnet, MA 02743
Upper Acushnet NeighborhoodEstimated Value: $591,000 - $719,000
3
Beds
3
Baths
3,029
Sq Ft
$223/Sq Ft
Est. Value
About This Home
This home is located at 3 Scotts Way, Acushnet, MA 02743 and is currently estimated at $675,109, approximately $222 per square foot. 3 Scotts Way is a home located in Bristol County with nearby schools including Acushnet Elementary School, Albert F Ford Middle School, and Alma Del Mar Charter School.
Ownership History
Date
Name
Owned For
Owner Type
Purchase Details
Closed on
Aug 4, 2010
Sold by
Costa Tr Durval R and Costa Maria J
Bought by
Nascimento Daniel L and Nascimento Joann A
Current Estimated Value
Home Financials for this Owner
Home Financials are based on the most recent Mortgage that was taken out on this home.
Original Mortgage
$170,000
Outstanding Balance
$113,461
Interest Rate
4.73%
Mortgage Type
Purchase Money Mortgage
Estimated Equity
$561,648
Create a Home Valuation Report for This Property
The Home Valuation Report is an in-depth analysis detailing your home's value as well as a comparison with similar homes in the area
Home Values in the Area
Average Home Value in this Area
Purchase History
| Date | Buyer | Sale Price | Title Company |
|---|---|---|---|
| Nascimento Daniel L | $340,000 | -- |
Source: Public Records
Mortgage History
| Date | Status | Borrower | Loan Amount |
|---|---|---|---|
| Open | Nascimento Daniel L | $170,000 |
Source: Public Records
Tax History Compared to Growth
Tax History
| Year | Tax Paid | Tax Assessment Tax Assessment Total Assessment is a certain percentage of the fair market value that is determined by local assessors to be the total taxable value of land and additions on the property. | Land | Improvement |
|---|---|---|---|---|
| 2025 | $58 | $539,800 | $141,100 | $398,700 |
| 2024 | $5,843 | $512,100 | $133,700 | $378,400 |
| 2023 | $5,752 | $479,300 | $121,300 | $358,000 |
| 2022 | $5,422 | $408,600 | $113,900 | $294,700 |
| 2021 | $5,388 | $389,600 | $113,900 | $275,700 |
| 2020 | $5,326 | $382,100 | $106,400 | $275,700 |
| 2019 | $5,339 | $376,500 | $101,500 | $275,000 |
| 2018 | $5,149 | $357,100 | $101,500 | $255,600 |
| 2017 | $5,019 | $347,600 | $101,500 | $246,100 |
| 2016 | $4,728 | $325,400 | $101,500 | $223,900 |
| 2015 | $4,647 | $325,400 | $101,500 | $223,900 |
Source: Public Records
Map
Nearby Homes