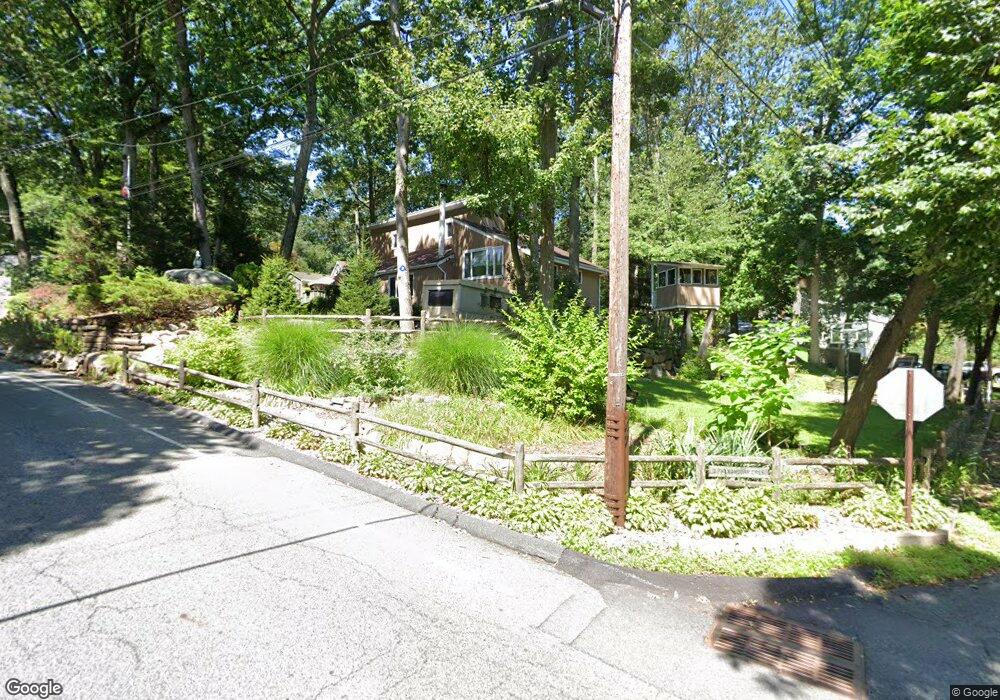
3 Shenandoah Crescent Wharton, NJ 07885
Estimated Value: $493,000
--
Bed
--
Bath
1,976
Sq Ft
$249/Sq Ft
Est. Value
About This Home
This home is located at 3 Shenandoah Crescent, Wharton, NJ 07885 and is currently estimated at $493,000, approximately $249 per square foot. 3 Shenandoah Crescent is a home located in Morris County with nearby schools including Jefferson Township Middle School and Jefferson Township High School.
Ownership History
Date
Name
Owned For
Owner Type
Purchase Details
Closed on
May 25, 2001
Sold by
Evans Darlene
Bought by
Trocha Robert and Nicholasi Dina
Current Estimated Value
Home Financials for this Owner
Home Financials are based on the most recent Mortgage that was taken out on this home.
Original Mortgage
$193,600
Outstanding Balance
$72,611
Interest Rate
7.09%
Estimated Equity
$420,389
Purchase Details
Closed on
Dec 1, 2000
Sold by
Johnson Keith J and Johnson Monica B
Bought by
Evans Darlene Joy
Home Financials for this Owner
Home Financials are based on the most recent Mortgage that was taken out on this home.
Original Mortgage
$140,000
Interest Rate
7.71%
Mortgage Type
Stand Alone First
Purchase Details
Closed on
Sep 6, 1995
Sold by
Johnson Keith J
Bought by
Johnson Keith J and Johnson Monica B
Create a Home Valuation Report for This Property
The Home Valuation Report is an in-depth analysis detailing your home's value as well as a comparison with similar homes in the area
Home Values in the Area
Average Home Value in this Area
Purchase History
| Date | Buyer | Sale Price | Title Company |
|---|---|---|---|
| Trocha Robert | $242,000 | -- | |
| Evans Darlene Joy | $230,000 | -- | |
| Johnson Keith J | -- | -- |
Source: Public Records
Mortgage History
| Date | Status | Borrower | Loan Amount |
|---|---|---|---|
| Open | Trocha Robert | $193,600 | |
| Previous Owner | Evans Darlene Joy | $140,000 |
Source: Public Records
Tax History Compared to Growth
Tax History
| Year | Tax Paid | Tax Assessment Tax Assessment Total Assessment is a certain percentage of the fair market value that is determined by local assessors to be the total taxable value of land and additions on the property. | Land | Improvement |
|---|---|---|---|---|
| 2025 | $9,204 | $306,600 | $121,500 | $185,100 |
| 2024 | $8,971 | $306,600 | $121,500 | $185,100 |
| 2023 | $8,971 | $306,600 | $121,500 | $185,100 |
| 2022 | $8,971 | $306,600 | $121,500 | $185,100 |
| 2021 | $8,566 | $306,600 | $121,500 | $185,100 |
| 2020 | $8,422 | $306,600 | $121,500 | $185,100 |
| 2019 | $8,206 | $298,500 | $120,300 | $178,200 |
| 2018 | $7,988 | $286,500 | $115,100 | $171,400 |
| 2017 | $8,012 | $282,300 | $117,100 | $165,200 |
| 2016 | $7,782 | $289,400 | $122,800 | $166,600 |
| 2015 | $7,331 | $266,300 | $110,700 | $155,600 |
| 2014 | $7,524 | $276,300 | $120,700 | $155,600 |
Source: Public Records
Map
Nearby Homes
- 7 Shenandoah Crescent
- 33 Shawnee Pkwy
- 38 E Shawnee Trail
- 9 Jessica Ct
- 110 E Shawnee Trail
- 30 State Route 181
- 8 Abbott Dr
- 59 Sachem Rd
- 31 Crescent Dr
- 32 Alpine Dr
- 148 New Jersey 181
- 27 Yacht Club Dr
- 33 Shore Rd
- 17-19 Shore Rd
- 24 Shore Rd
- 00 Swan Ln
- 727 Woodport Rd
- 00 Swan Boa Vista Dr
- 73 Edison Rd
- 680 New Jersey 15 Unit 60
- 5 Shenandoah Crescent
- 8 Pathfinder Trail
- 2 Shenandoah Crescent
- 1 E Shawnee Trail
- 10 Pathfinder Trail
- 4 E Shawnee Trail
- 36 Shawnee Pkwy
- 2 E Shawnee Trail
- 6 Shenandoah Crescent
- 18 Shenandoah Crescent
- 8 E Shawnee Trail
- 12 Pathfinder Trail
- 8 Shenandoah Crescent
- 9 Shenandoah Crescent
- 34 Shawnee Pkwy
- 7 Pathfinder Trail
- 5 Pathfinder Trail
- 9 Pathfinder Trail
- 37 W Lakeview Trail
- 32 Shawnee Pkwy