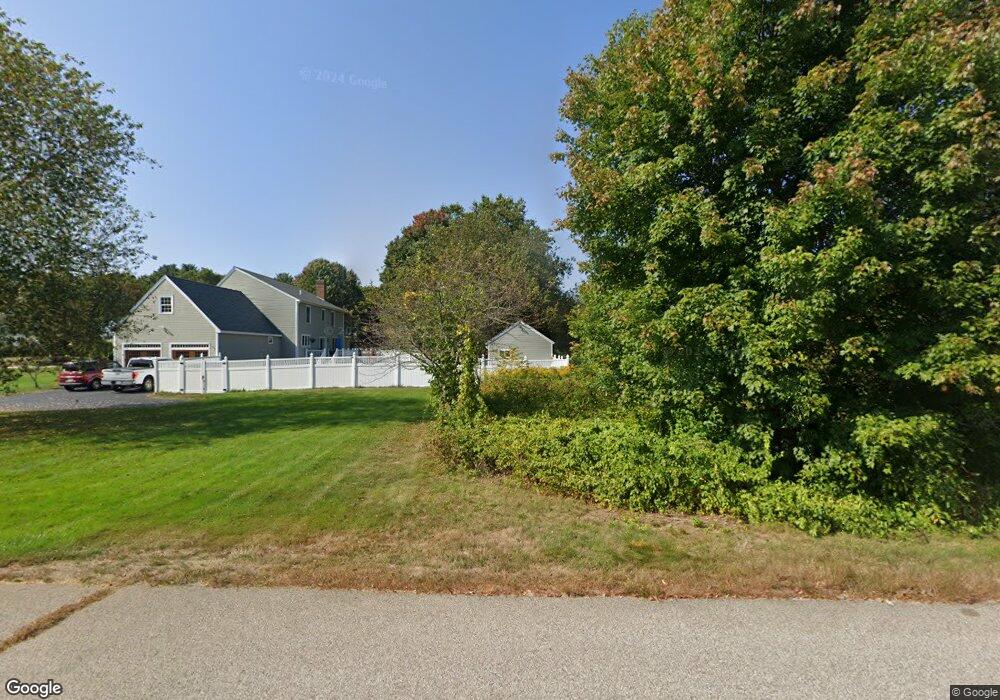
3 Shepherds Ln North Hampton, NH 03862
Estimated Value: $1,148,000 - $1,479,000
4
Beds
4
Baths
3,831
Sq Ft
$345/Sq Ft
Est. Value
About This Home
This home is located at 3 Shepherds Ln, North Hampton, NH 03862 and is currently estimated at $1,320,606, approximately $344 per square foot. 3 Shepherds Ln is a home located in Rockingham County with nearby schools including North Hampton School, Winnacunnet High School, and Acorn School.
Ownership History
Date
Name
Owned For
Owner Type
Purchase Details
Closed on
Jul 8, 2010
Sold by
Dill Glenn D and Dill Jeana B
Bought by
Brophy Mark W and Brophy Leslie A
Current Estimated Value
Home Financials for this Owner
Home Financials are based on the most recent Mortgage that was taken out on this home.
Original Mortgage
$485,000
Outstanding Balance
$323,254
Interest Rate
4.78%
Mortgage Type
Purchase Money Mortgage
Estimated Equity
$997,352
Purchase Details
Closed on
May 15, 2002
Sold by
Mcmahon Michael H
Bought by
Dill Glenn D and Dill Jeana B
Create a Home Valuation Report for This Property
The Home Valuation Report is an in-depth analysis detailing your home's value as well as a comparison with similar homes in the area
Home Values in the Area
Average Home Value in this Area
Purchase History
| Date | Buyer | Sale Price | Title Company |
|---|---|---|---|
| Brophy Mark W | $615,000 | -- | |
| Dill Glenn D | $539,900 | -- |
Source: Public Records
Mortgage History
| Date | Status | Borrower | Loan Amount |
|---|---|---|---|
| Open | Dill Glenn D | $485,000 | |
| Previous Owner | Dill Glenn D | $60,000 | |
| Previous Owner | Dill Glenn D | $30,000 | |
| Previous Owner | Dill Glenn D | $65,000 |
Source: Public Records
Tax History
| Year | Tax Paid | Tax Assessment Tax Assessment Total Assessment is a certain percentage of the fair market value that is determined by local assessors to be the total taxable value of land and additions on the property. | Land | Improvement |
|---|---|---|---|---|
| 2024 | $13,582 | $1,061,100 | $352,800 | $708,300 |
| 2023 | $13,211 | $1,061,100 | $352,800 | $708,300 |
| 2022 | $12,160 | $708,200 | $227,700 | $480,500 |
| 2021 | $11,735 | $708,200 | $227,700 | $480,500 |
| 2020 | $11,976 | $708,200 | $227,700 | $480,500 |
| 2019 | $11,827 | $708,200 | $227,700 | $480,500 |
| 2018 | $11,501 | $708,200 | $227,700 | $480,500 |
| 2017 | $10,802 | $583,900 | $206,000 | $377,900 |
| 2016 | $10,388 | $583,900 | $206,000 | $377,900 |
| 2015 | $10,207 | $583,900 | $206,000 | $377,900 |
| 2014 | $9,955 | $583,900 | $206,000 | $377,900 |
| 2013 | $9,780 | $583,900 | $206,000 | $377,900 |
Source: Public Records
Map
Nearby Homes
- 36 Seabreeze Dr
- 20 Sandpiper Path
- 25 Stevens Rd
- 11 Stoneledge Rd
- 4 Limestone Way
- 9 Slate Run
- 3 Slate Run
- 49 Exeter Rd
- 231 Post Rd
- 38 Mill Rd
- 69 Exeter Rd
- 11 Lamson Ln
- 193 Mill Rd
- 143 Walnut Ave
- 8 Winterberry Ln
- Homesite 4 Windsong Place
- Homesite 1 Windsong Place
- Homesite 2 Windsong Place
- 120 Exeter Rd
- 495 South Rd
Your Personal Tour Guide
Ask me questions while you tour the home.