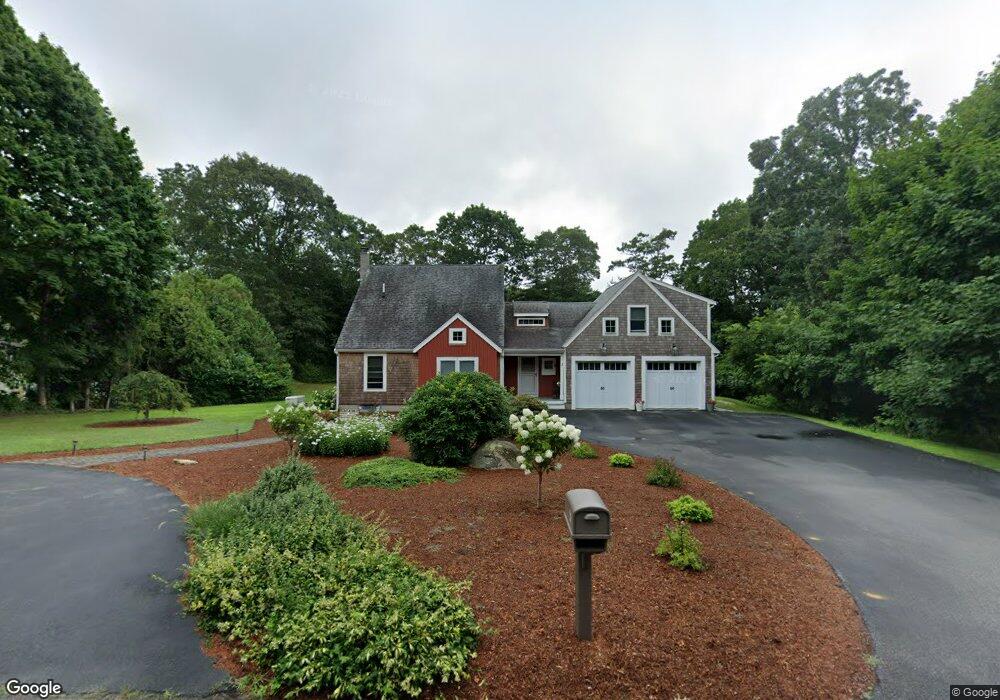
3 Sherry Ln Pocasset, MA 02559
Monument Beach NeighborhoodEstimated Value: $621,000 - $972,000
3
Beds
3
Baths
2,160
Sq Ft
$357/Sq Ft
Est. Value
About This Home
This home is located at 3 Sherry Ln, Pocasset, MA 02559 and is currently estimated at $771,707, approximately $357 per square foot. 3 Sherry Ln is a home located in Barnstable County with nearby schools including Bourne High School, Cadence Academy Preschool - Bourne, and St Margaret Regional School.
Ownership History
Date
Name
Owned For
Owner Type
Purchase Details
Closed on
May 6, 2024
Sold by
Berry Marcia L and Berry Delsie Michael
Bought by
3 Sherry Lane Rt and Berry
Current Estimated Value
Purchase Details
Closed on
Jan 18, 2017
Sold by
Berry Marcia L
Bought by
Berry Marcia L and Berry Delsie Michael
Create a Home Valuation Report for This Property
The Home Valuation Report is an in-depth analysis detailing your home's value as well as a comparison with similar homes in the area
Home Values in the Area
Average Home Value in this Area
Purchase History
| Date | Buyer | Sale Price | Title Company |
|---|---|---|---|
| 3 Sherry Lane Rt | -- | None Available | |
| 3 Sherry Lane Rt | -- | None Available | |
| 3 Sherry Lane Rt | -- | None Available | |
| Berry Marcia L | -- | -- | |
| Berry Marcia L | -- | -- | |
| Berry Marcia L | -- | -- |
Source: Public Records
Mortgage History
| Date | Status | Borrower | Loan Amount |
|---|---|---|---|
| Previous Owner | Berry Marcia L | $124,000 | |
| Previous Owner | Berry Marcia L | $75,000 |
Source: Public Records
Tax History Compared to Growth
Tax History
| Year | Tax Paid | Tax Assessment Tax Assessment Total Assessment is a certain percentage of the fair market value that is determined by local assessors to be the total taxable value of land and additions on the property. | Land | Improvement |
|---|---|---|---|---|
| 2025 | $5,790 | $741,300 | $198,200 | $543,100 |
| 2024 | $5,706 | $711,500 | $188,800 | $522,700 |
| 2023 | $5,593 | $634,800 | $167,100 | $467,700 |
| 2022 | $5,243 | $519,600 | $147,900 | $371,700 |
| 2021 | $5,097 | $473,300 | $134,600 | $338,700 |
| 2020 | $4,771 | $444,200 | $133,300 | $310,900 |
| 2019 | $4,487 | $426,900 | $133,300 | $293,600 |
| 2018 | $3,613 | $342,800 | $127,000 | $215,800 |
| 2017 | $3,342 | $324,500 | $119,500 | $205,000 |
| 2016 | $3,471 | $341,600 | $119,500 | $222,100 |
| 2015 | $2,010 | $199,600 | $106,900 | $92,700 |
Source: Public Records
Map
Nearby Homes
- 18 Douglas Ave
- 501 County Rd
- 566 Shore Rd
- 515 County Rd
- 30 Howard Ave
- 18 Carlton Rd
- 105 Clay Pond Rd
- 93 Valley Bars Rd
- 39 Bennets Neck Dr
- 12 Beachwood Rd
- 18 Quaker Ln
- 2 Westerly Dr
- 203 County Rd
- 14 Navajo Rd
- 16 Amberwood Ct
- 709 County Rd
- 34 Turnberry Rd
- 174 Barlows Landing Rd
- 12 Turnberry Rd Unit 12
- 940 County Rd