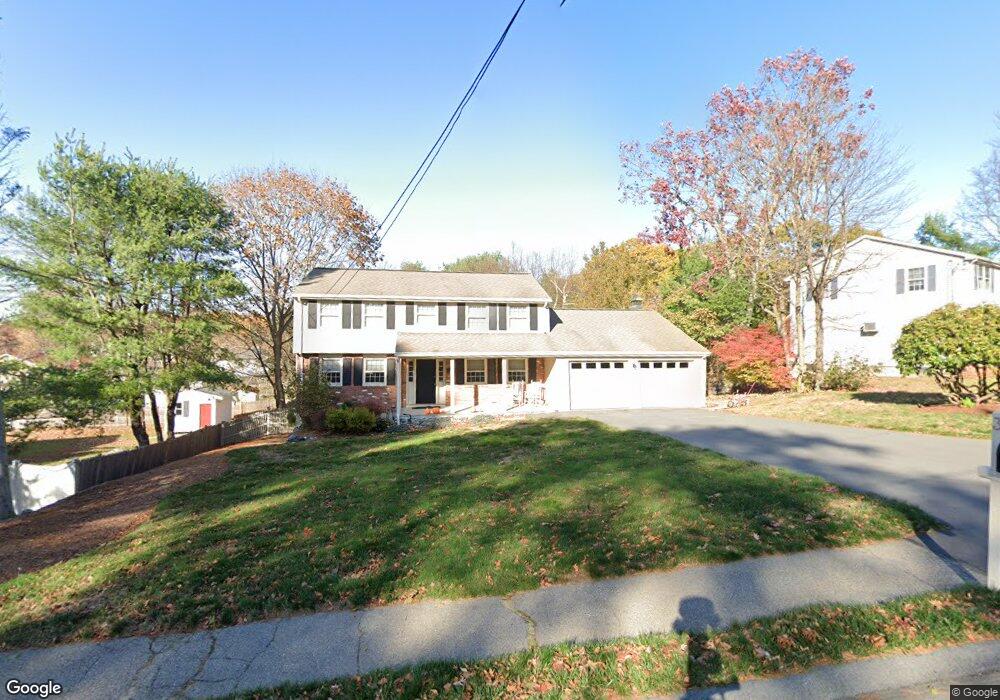
3 Sparhawk Dr Burlington, MA 01803
Burlington Town Center NeighborhoodEstimated Value: $951,000 - $1,057,000
4
Beds
3
Baths
2,144
Sq Ft
$469/Sq Ft
Est. Value
About This Home
This home is located at 3 Sparhawk Dr, Burlington, MA 01803 and is currently estimated at $1,004,989, approximately $468 per square foot. 3 Sparhawk Dr is a home located in Middlesex County with nearby schools including Burlington High School, Marshall Simonds Middle School, and Mount Hope Christian School.
Ownership History
Date
Name
Owned For
Owner Type
Purchase Details
Closed on
Apr 10, 2019
Sold by
Deluca Ft
Bought by
Shannon Carl F and Shannon Colleen M
Current Estimated Value
Home Financials for this Owner
Home Financials are based on the most recent Mortgage that was taken out on this home.
Original Mortgage
$560,000
Outstanding Balance
$492,340
Interest Rate
4.3%
Mortgage Type
New Conventional
Estimated Equity
$512,649
Purchase Details
Closed on
Feb 14, 2017
Sold by
Deluca Michael A and Deluca Emily T
Bought by
Deluca Ft
Create a Home Valuation Report for This Property
The Home Valuation Report is an in-depth analysis detailing your home's value as well as a comparison with similar homes in the area
Home Values in the Area
Average Home Value in this Area
Purchase History
| Date | Buyer | Sale Price | Title Company |
|---|---|---|---|
| Shannon Carl F | $700,700 | -- | |
| Deluca Ft | -- | -- |
Source: Public Records
Mortgage History
| Date | Status | Borrower | Loan Amount |
|---|---|---|---|
| Open | Shannon Carl F | $560,000 |
Source: Public Records
Tax History Compared to Growth
Tax History
| Year | Tax Paid | Tax Assessment Tax Assessment Total Assessment is a certain percentage of the fair market value that is determined by local assessors to be the total taxable value of land and additions on the property. | Land | Improvement |
|---|---|---|---|---|
| 2025 | $7,338 | $847,400 | $437,100 | $410,300 |
| 2024 | $7,032 | $786,600 | $399,100 | $387,500 |
| 2023 | $6,820 | $725,500 | $345,900 | $379,600 |
| 2022 | $6,642 | $667,500 | $314,600 | $352,900 |
| 2021 | $6,318 | $635,000 | $299,400 | $335,600 |
| 2020 | $5,813 | $603,000 | $294,600 | $308,400 |
| 2019 | $5,839 | $557,200 | $275,600 | $281,600 |
| 2018 | $5,800 | $546,100 | $275,600 | $270,500 |
| 2017 | $5,644 | $546,100 | $275,600 | $270,500 |
| 2016 | $5,610 | $489,500 | $237,600 | $251,900 |
| 2015 | $5,556 | $489,500 | $237,600 | $251,900 |
| 2014 | $5,369 | $447,400 | $205,300 | $242,100 |
Source: Public Records
Map
Nearby Homes
- 210 Winn St
- 38 Freeport Dr
- 6 Kendal Dr
- 129 Cambridge St Unit 1
- 21 Spring Valley Rd
- 29 Grove Ln Unit 29
- 23 Ward St Unit A
- 50 Hill Cir
- 16 Sunnyside Rd
- 6 Tidd Ave
- 6R & 6 Tidd Ave
- 4 Ardmore Ave
- 29 Overlook Ave
- 10 Murray Ave Unit 15
- 846 Main St
- 12 Murray Ave Unit 18
- 6 Arthur Woods Ave
- 5 Shady Lane Dr
- 27 Purity Springs Rd
- 26 E Dexter Ave