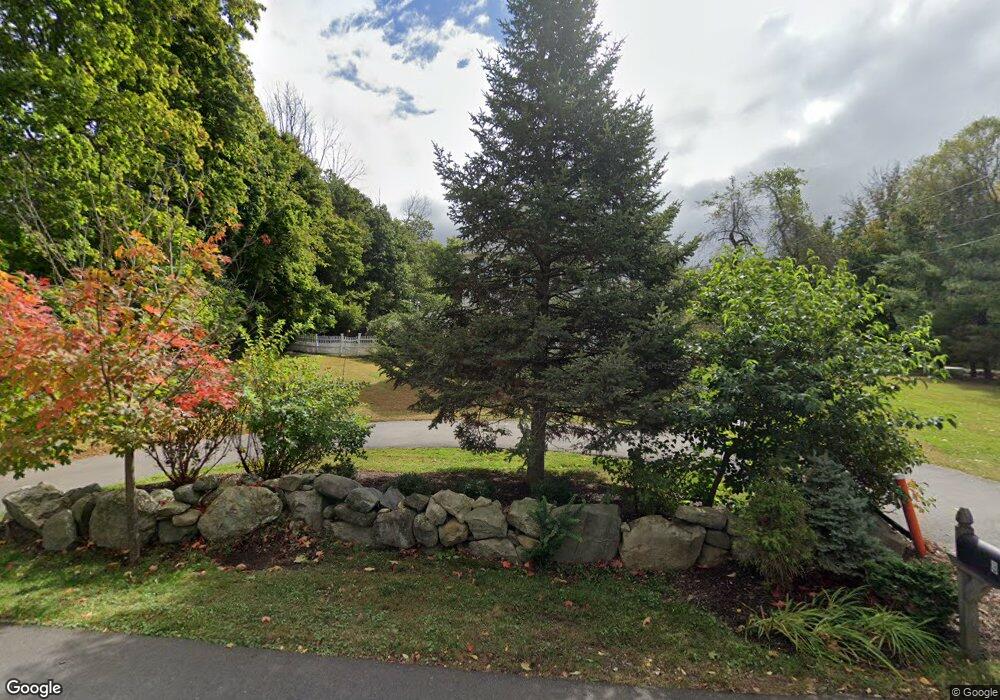
3 Stinson Rd Andover, MA 01810
Phillips Academy NeighborhoodEstimated Value: $1,135,000 - $1,218,500
5
Beds
3
Baths
3,012
Sq Ft
$395/Sq Ft
Est. Value
About This Home
This home is located at 3 Stinson Rd, Andover, MA 01810 and is currently estimated at $1,188,375, approximately $394 per square foot. 3 Stinson Rd is a home located in Essex County with nearby schools including Bancroft Elementary School, Doherty Middle School, and Andover High School.
Ownership History
Date
Name
Owned For
Owner Type
Purchase Details
Closed on
Nov 8, 2018
Sold by
Braman Stephen D and Rechisky Lisa A
Bought by
Rechisky Braman Ft
Current Estimated Value
Purchase Details
Closed on
Jun 24, 2008
Sold by
Casanave Rt and Casanave Marilyn H
Bought by
Braman Stephen D and Rechisky Lisa A
Home Financials for this Owner
Home Financials are based on the most recent Mortgage that was taken out on this home.
Original Mortgage
$417,000
Interest Rate
6.1%
Mortgage Type
Purchase Money Mortgage
Create a Home Valuation Report for This Property
The Home Valuation Report is an in-depth analysis detailing your home's value as well as a comparison with similar homes in the area
Home Values in the Area
Average Home Value in this Area
Purchase History
| Date | Buyer | Sale Price | Title Company |
|---|---|---|---|
| Rechisky Braman Ft | -- | -- | |
| Braman Stephen D | $580,000 | -- |
Source: Public Records
Mortgage History
| Date | Status | Borrower | Loan Amount |
|---|---|---|---|
| Previous Owner | Braman Stephen D | $417,000 |
Source: Public Records
Tax History Compared to Growth
Tax History
| Year | Tax Paid | Tax Assessment Tax Assessment Total Assessment is a certain percentage of the fair market value that is determined by local assessors to be the total taxable value of land and additions on the property. | Land | Improvement |
|---|---|---|---|---|
| 2024 | $13,623 | $1,057,700 | $587,200 | $470,500 |
| 2023 | $13,010 | $952,400 | $528,900 | $423,500 |
| 2022 | $12,464 | $853,700 | $468,100 | $385,600 |
| 2021 | $11,906 | $778,700 | $425,500 | $353,200 |
| 2020 | $11,415 | $760,500 | $415,200 | $345,300 |
| 2019 | $11,227 | $735,200 | $399,000 | $336,200 |
| 2018 | $10,707 | $684,600 | $376,300 | $308,300 |
| 2017 | $10,237 | $674,400 | $368,800 | $305,600 |
| 2016 | $9,995 | $674,400 | $368,800 | $305,600 |
| 2015 | $9,615 | $642,300 | $354,800 | $287,500 |
Source: Public Records
Map
Nearby Homes
- 2 Blueberry Hill Rd
- 5 Stinson Rd
- 6 Stinson Rd
- 9 Stinson Rd
- 130 Holt Rd
- 3 Blueberry Hill Rd
- 105 Holt Rd
- 127 Holt Rd
- 133 Holt Rd
- 5 Blueberry Hill Rd
- 6 Blueberry Hill Rd
- 11 Stinson Rd
- 101 Holt Rd
- 132 Holt Rd
- 27 Blueberry Hill Rd
- 109 Holt Rd
- 7 Blueberry Hill Rd
- 8 Blueberry Hill Rd
- 89 Holt Rd
- 138 Holt Rd