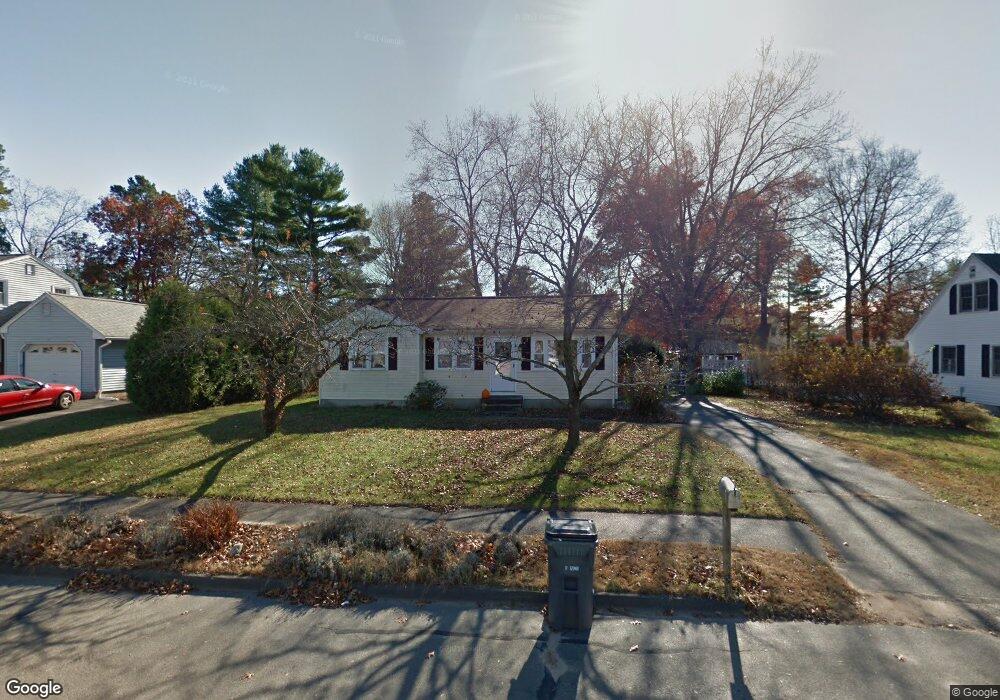
3 Susan Dr Easthampton, MA 01027
Estimated Value: $323,000 - $368,000
3
Beds
2
Baths
938
Sq Ft
$363/Sq Ft
Est. Value
About This Home
This home is located at 3 Susan Dr, Easthampton, MA 01027 and is currently estimated at $340,655, approximately $363 per square foot. 3 Susan Dr is a home located in Hampshire County with nearby schools including Easthampton High School, Hilltown Cooperative Charter Public School, and Calvary Baptist Christian School.
Ownership History
Date
Name
Owned For
Owner Type
Purchase Details
Closed on
Apr 27, 2006
Sold by
Burdeau Robert P and Burdeau Theresa R
Bought by
Burdeau Theresa R
Current Estimated Value
Purchase Details
Closed on
Jun 11, 1999
Sold by
Landry Frank R
Bought by
Lapinski Kristi L and Lapkinski9 Timothy P
Home Financials for this Owner
Home Financials are based on the most recent Mortgage that was taken out on this home.
Original Mortgage
$91,400
Interest Rate
6.9%
Mortgage Type
Purchase Money Mortgage
Purchase Details
Closed on
Mar 31, 1999
Sold by
Department Of Housing & Urban Dev
Bought by
Hill William R
Home Financials for this Owner
Home Financials are based on the most recent Mortgage that was taken out on this home.
Original Mortgage
$102,250
Interest Rate
6.78%
Mortgage Type
Purchase Money Mortgage
Purchase Details
Closed on
Aug 13, 1998
Sold by
Bechdel James L
Bought by
Norwest Mtg Inc
Create a Home Valuation Report for This Property
The Home Valuation Report is an in-depth analysis detailing your home's value as well as a comparison with similar homes in the area
Home Values in the Area
Average Home Value in this Area
Purchase History
| Date | Buyer | Sale Price | Title Company |
|---|---|---|---|
| Burdeau Theresa R | -- | -- | |
| Lapinski Kristi L | $101,600 | -- | |
| Hill William R | $111,400 | -- | |
| Norwest Mtg Inc | $133,974 | -- |
Source: Public Records
Mortgage History
| Date | Status | Borrower | Loan Amount |
|---|---|---|---|
| Previous Owner | Norwest Mtg Inc | $60,000 | |
| Previous Owner | Norwest Mtg Inc | $91,400 | |
| Previous Owner | Norwest Mtg Inc | $102,250 | |
| Previous Owner | Norwest Mtg Inc | $74,400 |
Source: Public Records
Tax History Compared to Growth
Tax History
| Year | Tax Paid | Tax Assessment Tax Assessment Total Assessment is a certain percentage of the fair market value that is determined by local assessors to be the total taxable value of land and additions on the property. | Land | Improvement |
|---|---|---|---|---|
| 2025 | $3,881 | $283,900 | $118,300 | $165,600 |
| 2024 | $3,745 | $276,200 | $114,900 | $161,300 |
| 2023 | $2,866 | $195,600 | $90,400 | $105,200 |
| 2022 | $3,233 | $195,600 | $90,400 | $105,200 |
| 2021 | $3,526 | $201,000 | $90,400 | $110,600 |
| 2020 | $3,474 | $195,600 | $90,400 | $105,200 |
| 2019 | $2,923 | $189,100 | $90,400 | $98,700 |
| 2018 | $2,808 | $175,500 | $85,400 | $90,100 |
| 2017 | $2,739 | $169,000 | $82,100 | $86,900 |
| 2016 | $2,814 | $180,500 | $82,100 | $98,400 |
| 2015 | $2,735 | $180,500 | $82,100 | $98,400 |
Source: Public Records
Map
Nearby Homes
- 36 Line St
- 1 Plain St
- 95 Gunn Rd
- 4 Laurel Dr
- 245 Park St
- 48 Gunn Rd
- 2 W Park Dr
- 6 S St & Abutting Lots
- 7 Western View Rd
- 38 College Hwy
- 36 County Rd
- 41 South St Unit 11
- 385 Main St
- 12 Golden Cir
- 10 Golden Cir
- Lot 3R Pomeroy Meadow Rd
- M143 &152 Glendale St
- 19 Mount Tom Ave Unit 19
- 19 Nicols Way Unit 19
- Lot 92-00 White Loaf Rd