Estimated Value: $262,000 - $309,000
3
Beds
2
Baths
2,076
Sq Ft
$138/Sq Ft
Est. Value
About This Home
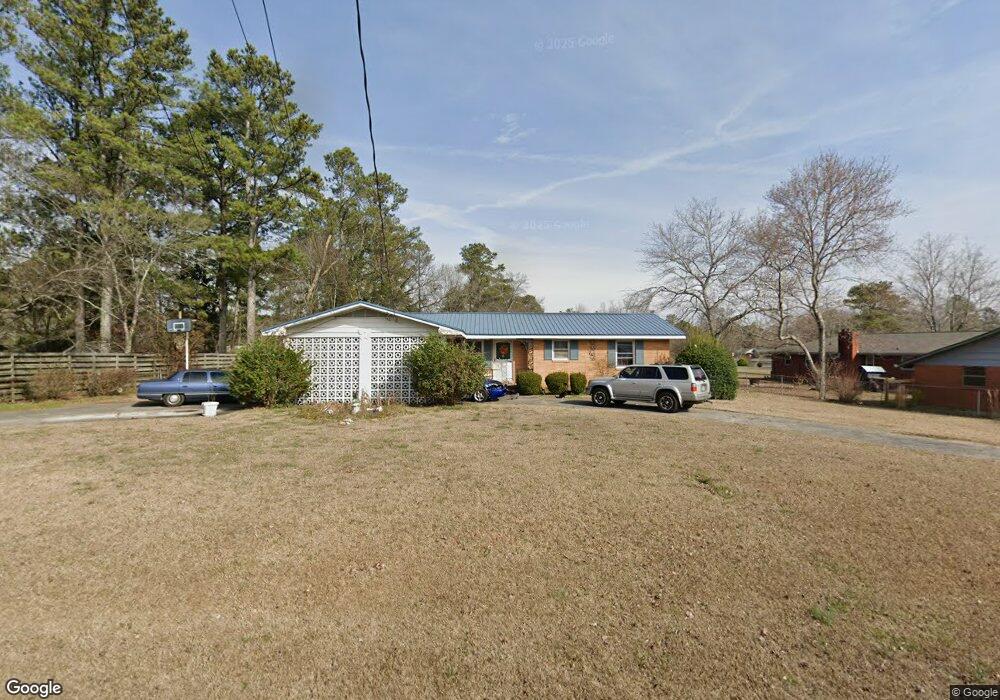
This home is located at 3 Sylvan Rd NE, Rome, GA 30165 and is currently estimated at $286,315, approximately $137 per square foot. 3 Sylvan Rd NE is a home located in Floyd County with nearby schools including Armuchee Middle School and Armuchee High School.
Ownership History
Date
Name
Owned For
Owner Type
Purchase Details
Closed on
Jul 13, 2009
Sold by
Lay Darin Dewayne
Bought by
Jones George Dennis
Current Estimated Value
Home Financials for this Owner
Home Financials are based on the most recent Mortgage that was taken out on this home.
Original Mortgage
$118,150
Interest Rate
5.53%
Mortgage Type
Balloon
Purchase Details
Closed on
Dec 21, 2001
Sold by
Lotero Alexander M and Mary Lotero
Bought by
Jones George Dennis and Darin Dewayne
Purchase Details
Closed on
Oct 13, 1995
Sold by
Lotero Alexander M
Bought by
Lotero Alexander M and Mary Lotero
Purchase Details
Closed on
Oct 19, 1989
Sold by
Poole Clinton
Bought by
Mings Chris L and Mings Nancy M
Purchase Details
Closed on
Oct 13, 1965
Sold by
Green Green J and Green Jimmy
Bought by
Poole Clinton
Purchase Details
Closed on
Jun 21, 1965
Sold by
Sylvan Acres Inc
Bought by
Green Green J and Green Jimmy
Purchase Details
Closed on
Jan 1, 1962
Bought by
Sylvan Acres Inc
Create a Home Valuation Report for This Property
The Home Valuation Report is an in-depth analysis detailing your home's value as well as a comparison with similar homes in the area
Home Values in the Area
Average Home Value in this Area
Purchase History
| Date | Buyer | Sale Price | Title Company |
|---|---|---|---|
| Jones George Dennis | -- | -- | |
| Jones George Dennis | $111,800 | -- | |
| Lotero Alexander M | -- | -- | |
| Lotero Alexander M | $73,000 | -- | |
| Mings Chris L | $86,000 | -- | |
| Poole Clinton | -- | -- | |
| Green Green J | $18,000 | -- | |
| Sylvan Acres Inc | -- | -- |
Source: Public Records
Mortgage History
| Date | Status | Borrower | Loan Amount |
|---|---|---|---|
| Closed | Jones George Dennis | $118,150 |
Source: Public Records
Tax History Compared to Growth
Tax History
| Year | Tax Paid | Tax Assessment Tax Assessment Total Assessment is a certain percentage of the fair market value that is determined by local assessors to be the total taxable value of land and additions on the property. | Land | Improvement |
|---|---|---|---|---|
| 2024 | $2,053 | $93,142 | $14,246 | $78,896 |
| 2023 | $2,055 | $88,379 | $12,822 | $75,557 |
| 2022 | $1,789 | $73,841 | $10,447 | $63,394 |
| 2021 | $1,565 | $61,456 | $9,498 | $51,958 |
| 2020 | $1,415 | $52,953 | $7,123 | $45,830 |
| 2019 | $1,319 | $48,695 | $7,123 | $41,572 |
| 2018 | $1,245 | $44,727 | $7,123 | $37,604 |
| 2017 | $1,079 | $36,359 | $7,123 | $29,236 |
| 2016 | $1,133 | $37,700 | $7,120 | $30,580 |
| 2015 | $1,113 | $37,700 | $7,120 | $30,580 |
| 2014 | $1,113 | $37,700 | $7,120 | $30,580 |
Source: Public Records
Map
Nearby Homes
- 1112 Old Dalton Rd NE
- 23 Whistling Oaks Dr NE
- 1040 Old Dalton Rd NE
- 3 Harbour Rd NE
- 2 Pippin Place NE
- 9 Royal Oak Dr NE
- 12 Majestic Oaks Way NE
- 8 Mossy Oaks Ln NE
- 12 Applewood Dr NE
- 65 Tency Ln NE
- 20 Pippin Place NE
- 2 Macintosh Dr NE
- 50 Tency Ln NE
- 13 Oak View Dr NE
- 129 Rising Fawn Trail NE
- 15 Oakcrest Trail NE
- 263 E Big Indian Trail NE
- 264 E Big Indian Trail NE
- The Coleman Plan at Southbend
- The Kensington II Plan at Southbend
- 1 Pine River Rd NE
- 1094 Old Dalton Rd NE
- 3 Pine River Rd NE
- 6 Sylvan Rd NE
- 4 Sylvan Rd NE
- 1072 Old Dalton Rd NE
- 2 Pine River Rd NE
- 8 Sylvan Rd NE
- 0 Pine River Rd NE Unit 8248552
- 0 Pine River Rd NE Unit 10229300
- 0 Pine River Rd NE Unit 7308055
- 0 Pine River Rd NE Unit 20145246
- 197,211 Old Dalton Rd NE
- 1128 Old Dalton Rd NE
- 7 Pine River Rd NE
- 10 Sylvan Rd NE
- 10 Sylvan Rd NE Unit 21
- 1089 Old Dalton Rd NE
- 1089 Old Dalton Rd NE
- 1089 Old Dalton Rd NE