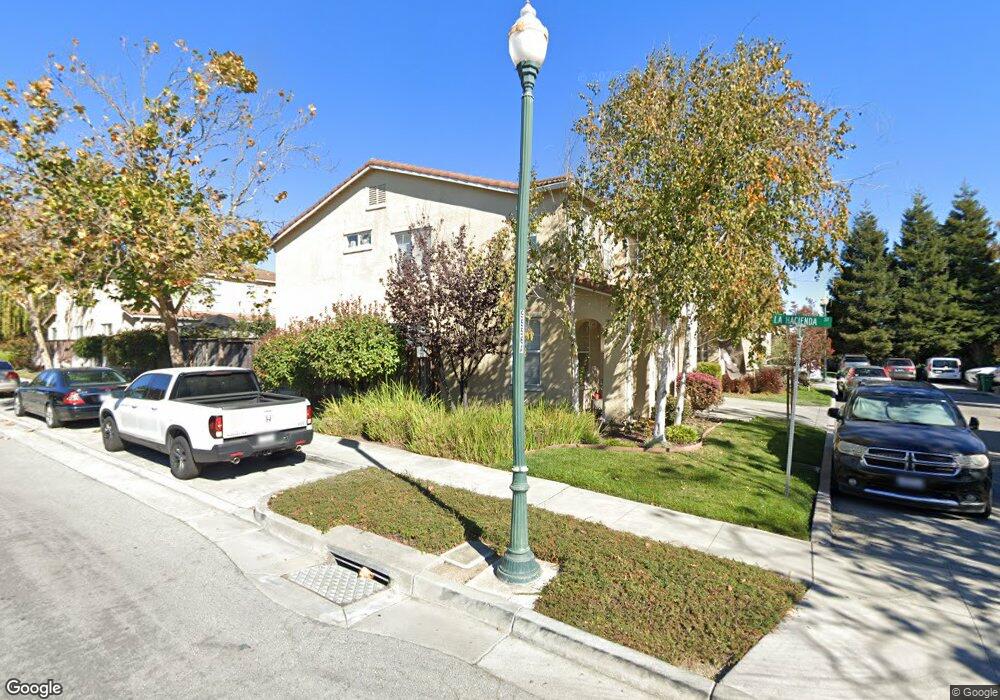
3 Via Ventana Ct Watsonville, CA 95076
Estimated Value: $921,082 - $962,000
4
Beds
3
Baths
2,199
Sq Ft
$429/Sq Ft
Est. Value
About This Home
This home is located at 3 Via Ventana Ct, Watsonville, CA 95076 and is currently estimated at $944,021, approximately $429 per square foot. 3 Via Ventana Ct is a home located in Santa Cruz County with nearby schools including Landmark Elementary School, Rolling Hills Middle School, and Pajaro Valley High School.
Ownership History
Date
Name
Owned For
Owner Type
Purchase Details
Closed on
Nov 4, 2010
Sold by
Clements Stanley G and Clements Darra L
Bought by
Russell James M and Russell Ana K Bocanegra
Current Estimated Value
Home Financials for this Owner
Home Financials are based on the most recent Mortgage that was taken out on this home.
Original Mortgage
$319,200
Outstanding Balance
$210,604
Interest Rate
4.27%
Mortgage Type
New Conventional
Estimated Equity
$733,417
Purchase Details
Closed on
Nov 21, 2003
Sold by
Lb/L-Duc Ii Franceschi Llc
Bought by
Clements Stanley G and Clements Darra L
Home Financials for this Owner
Home Financials are based on the most recent Mortgage that was taken out on this home.
Original Mortgage
$359,200
Interest Rate
5.75%
Mortgage Type
Purchase Money Mortgage
Create a Home Valuation Report for This Property
The Home Valuation Report is an in-depth analysis detailing your home's value as well as a comparison with similar homes in the area
Home Values in the Area
Average Home Value in this Area
Purchase History
| Date | Buyer | Sale Price | Title Company |
|---|---|---|---|
| Russell James M | $399,000 | Chicago Title Company | |
| Clements Stanley G | $449,500 | First American Title Co |
Source: Public Records
Mortgage History
| Date | Status | Borrower | Loan Amount |
|---|---|---|---|
| Open | Russell James M | $319,200 | |
| Previous Owner | Clements Stanley G | $359,200 | |
| Closed | Clements Stanley G | $89,800 |
Source: Public Records
Tax History Compared to Growth
Tax History
| Year | Tax Paid | Tax Assessment Tax Assessment Total Assessment is a certain percentage of the fair market value that is determined by local assessors to be the total taxable value of land and additions on the property. | Land | Improvement |
|---|---|---|---|---|
| 2025 | $5,841 | $511,190 | $306,714 | $204,476 |
| 2023 | $5,751 | $491,340 | $294,804 | $196,536 |
| 2022 | $5,649 | $481,706 | $289,024 | $192,682 |
| 2021 | $5,637 | $472,261 | $283,357 | $188,904 |
| 2020 | $5,556 | $467,418 | $280,451 | $186,967 |
| 2019 | $5,458 | $458,253 | $274,952 | $183,301 |
| 2018 | $5,321 | $449,268 | $269,561 | $179,707 |
| 2017 | $5,277 | $440,461 | $264,276 | $176,185 |
| 2016 | $5,139 | $431,824 | $259,094 | $172,730 |
| 2015 | $5,123 | $425,337 | $255,202 | $170,135 |
| 2014 | $5,013 | $417,005 | $250,203 | $166,802 |
Source: Public Records
Map
Nearby Homes
- 130 Skyline Vista Way
- 133 Skyline Vista Way
- 1031 Santa Rosa Ct
- 401 San Luis Ave
- 409 San Luis Ave
- 41 Pelican Dr
- 16 Vista Pointe Dr
- 127 Terry Loop
- 444 Sherwood Ct
- 235 Lee Rd
- 1630 W Beach St
- 99 Sincero Dr Unit 99
- 201 Silver Leaf Dr Unit A
- 66 Contento Dr Unit 66
- 219 2nd St
- 30 W Lake Ave
- 110 Crespi Cir Unit 110
- 3 Gonzales St
- 8 Kralj Dr
- 105 Palm Ave
- 7 Via Ventana Ct
- 2 Porta Vista Ct
- 6 Porta Vista Ct
- 11 Via Ventana Ct
- 2 Via Ventana Ct
- 20 La Hacienda St
- 6 Via Ventana Ct
- 24 La Hacienda St
- 16 La Hacienda St
- 10 Porta Vista Ct
- 28 La Hacienda St
- 10 Via Ventana Ct
- 12 La Hacienda St
- 35 La Hacienda St
- 32 La Hacienda St
- 3 Porta Vista Ct
- 19 Via Serra St
- 8 La Hacienda St
- 7 Porta Vista Ct
- 23 Via Serra St