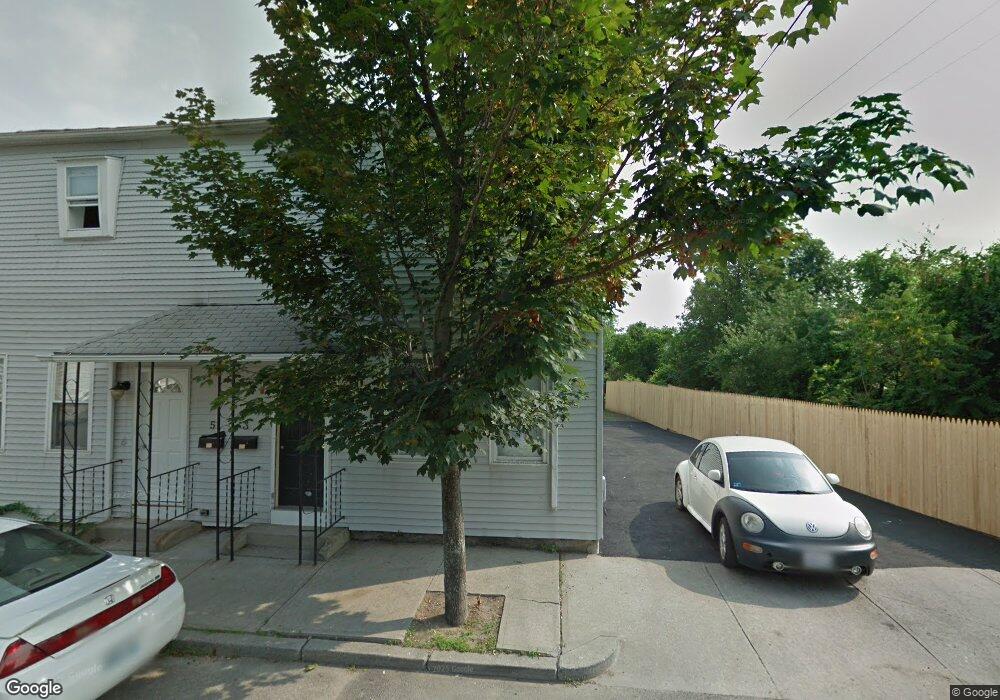
3 Whipple Ave Cranston, RI 02920
Arlington NeighborhoodEstimated Value: $457,775 - $592,000
6
Beds
4
Baths
2,090
Sq Ft
$251/Sq Ft
Est. Value
About This Home
This home is located at 3 Whipple Ave, Cranston, RI 02920 and is currently estimated at $525,194, approximately $251 per square foot. 3 Whipple Ave is a home located in Providence County with nearby schools including Hugh B. Bain Middle School, Cranston High School East, and Achievement First Iluminar Mayoral Academy.
Ownership History
Date
Name
Owned For
Owner Type
Purchase Details
Closed on
May 28, 2021
Sold by
Medina William J
Bought by
Esteban Michael J
Current Estimated Value
Purchase Details
Closed on
Dec 30, 2011
Sold by
Murphy William H
Bought by
Medina William J
Home Financials for this Owner
Home Financials are based on the most recent Mortgage that was taken out on this home.
Original Mortgage
$165,690
Interest Rate
4%
Purchase Details
Closed on
Jun 27, 2011
Sold by
Arion Const Llc
Bought by
Murphy William H
Purchase Details
Closed on
Jul 24, 2009
Sold by
Moore Karen L
Bought by
Natl City Mortgage
Create a Home Valuation Report for This Property
The Home Valuation Report is an in-depth analysis detailing your home's value as well as a comparison with similar homes in the area
Home Values in the Area
Average Home Value in this Area
Purchase History
| Date | Buyer | Sale Price | Title Company |
|---|---|---|---|
| Esteban Michael J | -- | None Available | |
| Medina William J | $170,000 | -- | |
| Murphy William H | -- | -- | |
| Natl City Mortgage | $122,000 | -- |
Source: Public Records
Mortgage History
| Date | Status | Borrower | Loan Amount |
|---|---|---|---|
| Previous Owner | Medina William J | $165,690 |
Source: Public Records
Tax History Compared to Growth
Tax History
| Year | Tax Paid | Tax Assessment Tax Assessment Total Assessment is a certain percentage of the fair market value that is determined by local assessors to be the total taxable value of land and additions on the property. | Land | Improvement |
|---|---|---|---|---|
| 2024 | $5,021 | $368,900 | $101,300 | $267,600 |
| 2023 | $4,317 | $228,400 | $44,400 | $184,000 |
| 2022 | $4,228 | $228,400 | $44,400 | $184,000 |
| 2021 | $4,111 | $228,400 | $44,400 | $184,000 |
| 2020 | $3,766 | $181,300 | $34,900 | $146,400 |
| 2019 | $3,766 | $181,300 | $34,900 | $146,400 |
| 2018 | $3,679 | $181,300 | $34,900 | $146,400 |
| 2017 | $2,973 | $129,600 | $15,900 | $113,700 |
| 2016 | $2,910 | $129,600 | $15,900 | $113,700 |
| 2015 | $2,910 | $129,600 | $15,900 | $113,700 |
| 2014 | $2,887 | $126,400 | $15,900 | $110,500 |
Source: Public Records
Map
Nearby Homes