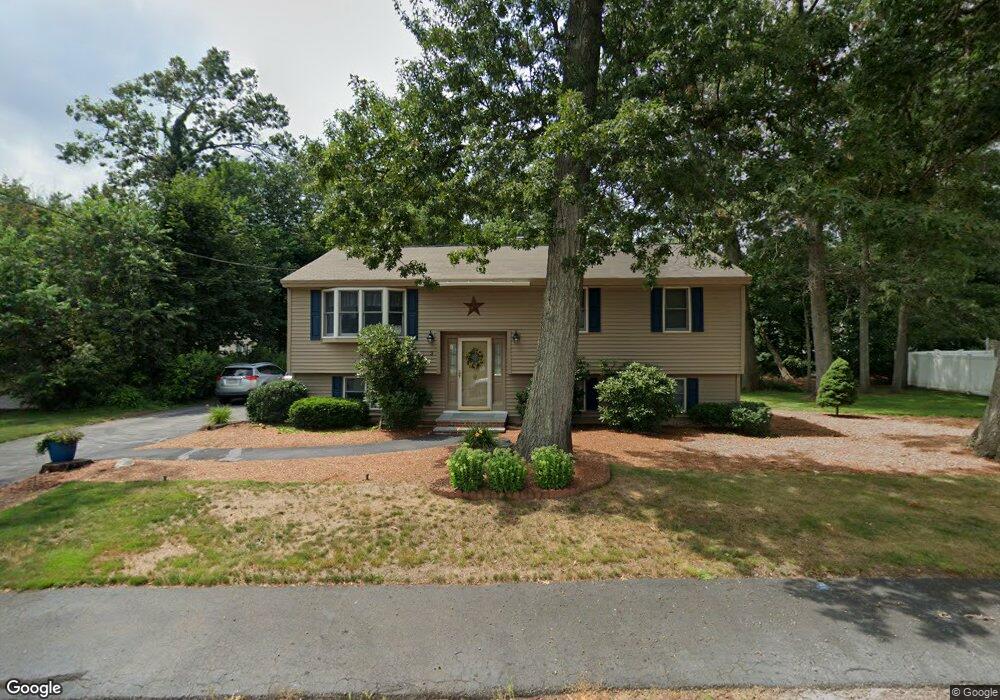
3 Wicks Cir Wilmington, MA 01887
Estimated Value: $558,000 - $704,000
4
Beds
1
Bath
1,008
Sq Ft
$608/Sq Ft
Est. Value
About This Home
This home is located at 3 Wicks Cir, Wilmington, MA 01887 and is currently estimated at $612,501, approximately $607 per square foot. 3 Wicks Cir is a home located in Middlesex County with nearby schools including Wilmington Middle School, Wilmington High School, and Abundant Life Christian School and Childcare.
Ownership History
Date
Name
Owned For
Owner Type
Purchase Details
Closed on
Oct 2, 2012
Sold by
Beals Robert C and Beals Nita A
Bought by
Nslr Irt
Current Estimated Value
Purchase Details
Closed on
Jan 15, 1993
Sold by
Chasse Francis R and Chasse Joyce
Bought by
Bond Kevin T
Home Financials for this Owner
Home Financials are based on the most recent Mortgage that was taken out on this home.
Original Mortgage
$90,000
Interest Rate
8.3%
Mortgage Type
Purchase Money Mortgage
Purchase Details
Closed on
Jun 26, 1967
Bought by
Beals Nancy E
Create a Home Valuation Report for This Property
The Home Valuation Report is an in-depth analysis detailing your home's value as well as a comparison with similar homes in the area
Home Values in the Area
Average Home Value in this Area
Purchase History
| Date | Buyer | Sale Price | Title Company |
|---|---|---|---|
| Nslr Irt | -- | -- | |
| Bond Kevin T | $100,000 | -- | |
| Beals Nancy E | -- | -- |
Source: Public Records
Mortgage History
| Date | Status | Borrower | Loan Amount |
|---|---|---|---|
| Previous Owner | Beals Nancy E | $30,000 | |
| Previous Owner | Beals Nancy E | $90,000 |
Source: Public Records
Tax History Compared to Growth
Tax History
| Year | Tax Paid | Tax Assessment Tax Assessment Total Assessment is a certain percentage of the fair market value that is determined by local assessors to be the total taxable value of land and additions on the property. | Land | Improvement |
|---|---|---|---|---|
| 2025 | $6,224 | $543,600 | $301,200 | $242,400 |
| 2024 | $6,176 | $540,300 | $301,200 | $239,100 |
| 2023 | $5,950 | $498,300 | $273,800 | $224,500 |
| 2022 | $5,622 | $431,500 | $228,200 | $203,300 |
| 2021 | $5,483 | $396,200 | $207,400 | $188,800 |
| 2020 | $5,482 | $403,700 | $207,400 | $196,300 |
| 2019 | $5,068 | $368,600 | $197,500 | $171,100 |
| 2018 | $4,788 | $332,300 | $188,100 | $144,200 |
| 2017 | $4,758 | $329,300 | $181,400 | $147,900 |
| 2016 | $4,521 | $309,000 | $172,800 | $136,200 |
| 2015 | $4,324 | $300,900 | $172,800 | $128,100 |
| 2014 | $4,067 | $285,600 | $164,500 | $121,100 |
Source: Public Records
Map
Nearby Homes