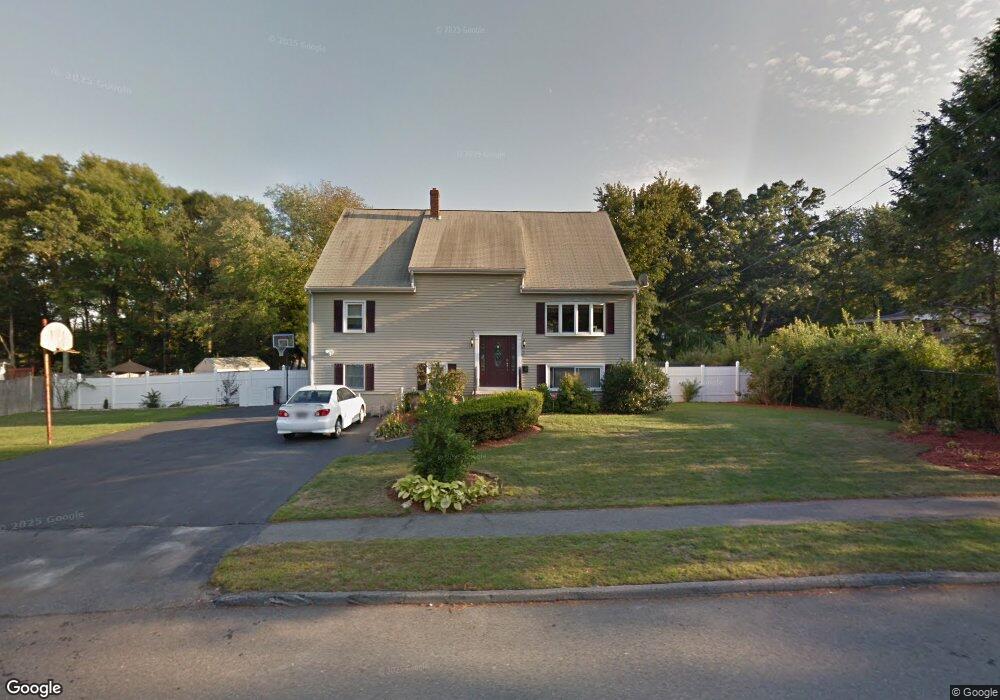
3 Worcester Rd Peabody, MA 01960
West Peabody NeighborhoodEstimated Value: $674,000 - $1,099,000
5
Beds
3
Baths
3,935
Sq Ft
$238/Sq Ft
Est. Value
About This Home
This home is located at 3 Worcester Rd, Peabody, MA 01960 and is currently estimated at $936,180, approximately $237 per square foot. 3 Worcester Rd is a home located in Essex County with nearby schools including Peabody Veterans Memorial High School and Covenant Christian Academy.
Ownership History
Date
Name
Owned For
Owner Type
Purchase Details
Closed on
Jul 27, 2020
Sold by
Dinush Dolores and Dinush Mary M
Bought by
Dinush Mary M
Current Estimated Value
Home Financials for this Owner
Home Financials are based on the most recent Mortgage that was taken out on this home.
Original Mortgage
$195,000
Outstanding Balance
$156,238
Interest Rate
3.1%
Mortgage Type
New Conventional
Estimated Equity
$779,942
Purchase Details
Closed on
Aug 27, 1999
Sold by
Sklivas Constantina
Bought by
Dinush Mary M and Dinush Dolores
Create a Home Valuation Report for This Property
The Home Valuation Report is an in-depth analysis detailing your home's value as well as a comparison with similar homes in the area
Home Values in the Area
Average Home Value in this Area
Purchase History
| Date | Buyer | Sale Price | Title Company |
|---|---|---|---|
| Dinush Mary M | -- | None Available | |
| Dinush Mary M | $254,500 | -- |
Source: Public Records
Mortgage History
| Date | Status | Borrower | Loan Amount |
|---|---|---|---|
| Open | Dinush Mary M | $195,000 | |
| Previous Owner | Dinush Mary M | $225,000 | |
| Previous Owner | Dinush Mary M | $201,500 | |
| Previous Owner | Dinush Mary M | $229,300 |
Source: Public Records
Tax History
| Year | Tax Paid | Tax Assessment Tax Assessment Total Assessment is a certain percentage of the fair market value that is determined by local assessors to be the total taxable value of land and additions on the property. | Land | Improvement |
|---|---|---|---|---|
| 2025 | $8,553 | $923,600 | $322,300 | $601,300 |
| 2024 | $8,104 | $888,600 | $322,300 | $566,300 |
| 2023 | $7,400 | $777,300 | $268,600 | $508,700 |
| 2022 | $6,892 | $682,400 | $233,600 | $448,800 |
| 2021 | $6,948 | $662,300 | $212,400 | $449,900 |
| 2020 | $6,747 | $628,200 | $212,400 | $415,800 |
| 2019 | $6,400 | $581,300 | $212,400 | $368,900 |
| 2018 | $6,258 | $546,100 | $189,600 | $356,500 |
| 2017 | $6,308 | $536,400 | $189,600 | $346,800 |
| 2016 | $6,153 | $516,200 | $189,600 | $326,600 |
| 2015 | $6,136 | $498,900 | $189,600 | $309,300 |
Source: Public Records
Map
Nearby Homes
- 23 Hamilton Rd
- 24 Worcester Rd
- 35 Catherine Dr
- 7 Pinewood Rd
- 4 Lowell St
- 31 Styles Dr
- 9 Stableford Ct Unit 9
- 1 Stableford Ct Unit 13
- 5 Stableford Ct Unit 11
- 7 Stableford Ct Unit 10
- 2 Sachem Rd
- 40 Glen Dr
- 19 Fairway Ln Unit 53
- 15 Fairway Ln Unit 55
- 15 Fairway Ln
- 10 Fairway Ln
- 1466 Main St
- 3 Anne Dr
- 1 Couture Way
- 12 Couture Way
Your Personal Tour Guide
Ask me questions while you tour the home.