3 Yale Ct Livingston, NJ 07039
Estimated Value: $1,501,000 - $1,989,000
--
Bed
--
Bath
4,908
Sq Ft
$359/Sq Ft
Est. Value
About This Home
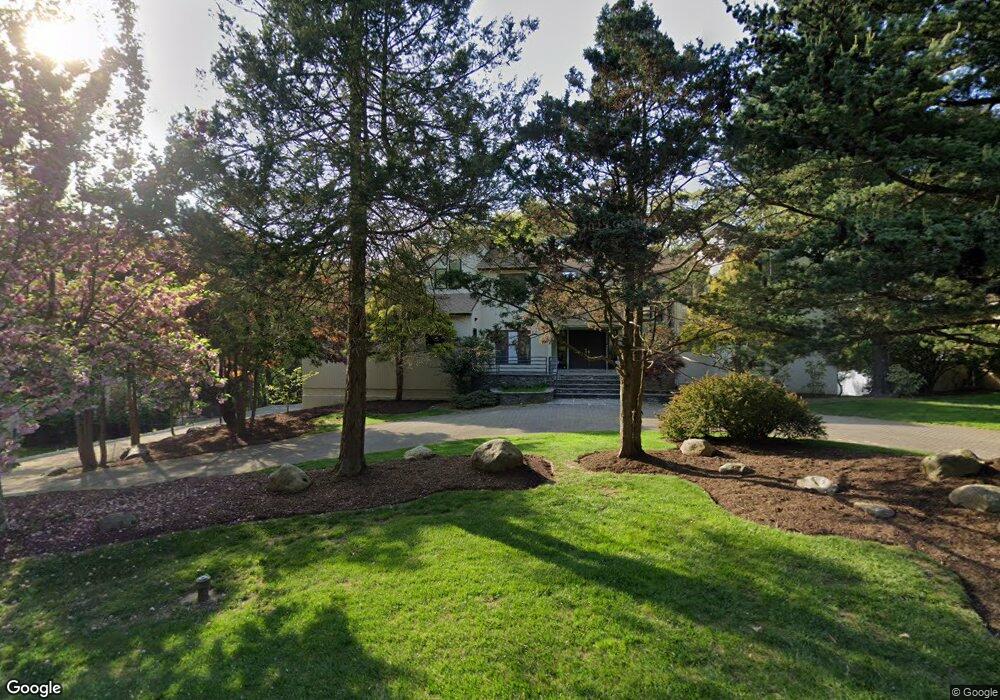
This home is located at 3 Yale Ct, Livingston, NJ 07039 and is currently estimated at $1,764,101, approximately $359 per square foot. 3 Yale Ct is a home located in Essex County with nearby schools including Livingston Sr High School and Mount Carmel Guild High School.
Ownership History
Date
Name
Owned For
Owner Type
Purchase Details
Closed on
Jun 30, 2025
Sold by
Bid Velji Narshi and Champa Velji
Bought by
Bose Kapil and Arora Priyanka
Current Estimated Value
Home Financials for this Owner
Home Financials are based on the most recent Mortgage that was taken out on this home.
Original Mortgage
$1,208,000
Outstanding Balance
$1,205,970
Interest Rate
6.89%
Mortgage Type
New Conventional
Estimated Equity
$558,131
Purchase Details
Closed on
Dec 11, 2007
Sold by
Bid Champa Velji
Bought by
Bid Velji Narshi and Bid Champa Velji
Create a Home Valuation Report for This Property
The Home Valuation Report is an in-depth analysis detailing your home's value as well as a comparison with similar homes in the area
Home Values in the Area
Average Home Value in this Area
Purchase History
| Date | Buyer | Sale Price | Title Company |
|---|---|---|---|
| Bose Kapil | $1,750,000 | Clear Skies Title | |
| Bid Velji Narshi | -- | None Available |
Source: Public Records
Mortgage History
| Date | Status | Borrower | Loan Amount |
|---|---|---|---|
| Open | Bose Kapil | $1,208,000 |
Source: Public Records
Tax History Compared to Growth
Tax History
| Year | Tax Paid | Tax Assessment Tax Assessment Total Assessment is a certain percentage of the fair market value that is determined by local assessors to be the total taxable value of land and additions on the property. | Land | Improvement |
|---|---|---|---|---|
| 2025 | $22,826 | $962,300 | $323,000 | $639,300 |
| 2024 | $22,826 | $962,300 | $323,000 | $639,300 |
| 2022 | $22,450 | $962,300 | $323,000 | $639,300 |
| 2021 | $22,268 | $962,300 | $323,000 | $639,300 |
| 2020 | $21,854 | $962,300 | $323,000 | $639,300 |
| 2019 | $30,102 | $1,150,700 | $407,200 | $743,500 |
| 2018 | $29,700 | $1,150,700 | $407,200 | $743,500 |
| 2017 | $29,308 | $1,150,700 | $407,200 | $743,500 |
| 2016 | $28,768 | $1,150,700 | $407,200 | $743,500 |
| 2015 | $28,342 | $1,150,700 | $407,200 | $743,500 |
| 2014 | $27,421 | $1,150,700 | $407,200 | $743,500 |
Source: Public Records
Map
Nearby Homes