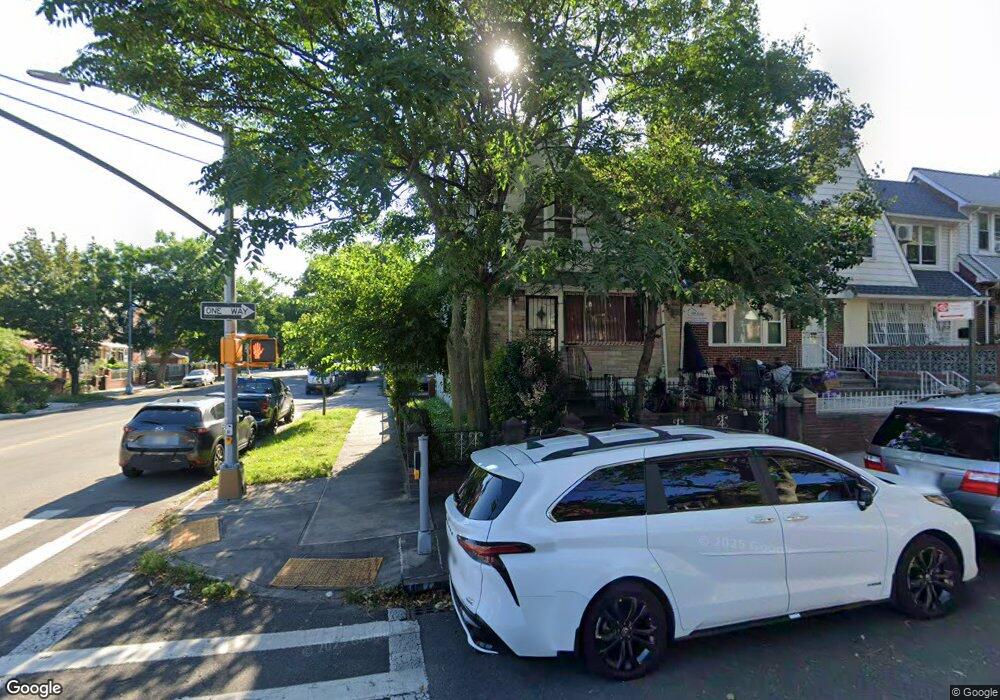
30-01 86th St Flushing, NY 11369
Jackson Heights NeighborhoodEstimated Value: $930,749 - $1,289,000
2
Beds
1
Bath
2,071
Sq Ft
$537/Sq Ft
Est. Value
About This Home
This home is located at 30-01 86th St, Flushing, NY 11369 and is currently estimated at $1,111,187, approximately $536 per square foot. 30-01 86th St is a home located in Queens County with nearby schools including P.S. 148, I.S. 145 Joseph Pulitzer Magnet School, and Newtown High School.
Ownership History
Date
Name
Owned For
Owner Type
Purchase Details
Closed on
Mar 1, 2002
Sold by
Abbas Syed Qamar and Qamar Shahla
Bought by
Qamar Shahla
Current Estimated Value
Home Financials for this Owner
Home Financials are based on the most recent Mortgage that was taken out on this home.
Original Mortgage
$233,000
Interest Rate
7.13%
Purchase Details
Closed on
Feb 14, 2000
Sold by
Qamar Syed
Bought by
Qamar Syed and Qamar Shahla
Purchase Details
Closed on
Jan 2, 1998
Sold by
Gharavi Azzudin E and Gharavi Azar
Bought by
Abbas Syed Qamar
Home Financials for this Owner
Home Financials are based on the most recent Mortgage that was taken out on this home.
Original Mortgage
$176,097
Interest Rate
6.9%
Create a Home Valuation Report for This Property
The Home Valuation Report is an in-depth analysis detailing your home's value as well as a comparison with similar homes in the area
Home Values in the Area
Average Home Value in this Area
Purchase History
| Date | Buyer | Sale Price | Title Company |
|---|---|---|---|
| Qamar Shahla | -- | -- | |
| Qamar Shahla | -- | -- | |
| Qamar Syed | -- | Commonwealth Land Title Ins | |
| Qamar Syed | -- | Commonwealth Land Title Ins | |
| Abbas Syed Qamar | $189,000 | Stewart Title Insurance Co | |
| Abbas Syed Qamar | $189,000 | Stewart Title Insurance Co |
Source: Public Records
Mortgage History
| Date | Status | Borrower | Loan Amount |
|---|---|---|---|
| Previous Owner | Qamar Shahla | $233,000 | |
| Previous Owner | Abbas Syed Qamar | $176,097 |
Source: Public Records
Tax History Compared to Growth
Tax History
| Year | Tax Paid | Tax Assessment Tax Assessment Total Assessment is a certain percentage of the fair market value that is determined by local assessors to be the total taxable value of land and additions on the property. | Land | Improvement |
|---|---|---|---|---|
| 2025 | $7,715 | $42,200 | $8,784 | $33,416 |
| 2024 | $7,727 | $39,812 | $8,510 | $31,302 |
| 2023 | $7,715 | $39,812 | $7,618 | $32,194 |
| 2022 | $7,107 | $59,160 | $11,940 | $47,220 |
| 2021 | $7,549 | $57,240 | $11,940 | $45,300 |
| 2020 | $7,148 | $52,260 | $11,940 | $40,320 |
| 2019 | $6,647 | $56,400 | $11,940 | $44,460 |
| 2018 | $6,465 | $33,177 | $8,400 | $24,777 |
| 2017 | $6,328 | $32,512 | $8,673 | $23,839 |
| 2016 | $5,900 | $32,512 | $8,673 | $23,839 |
| 2015 | $3,480 | $29,306 | $11,712 | $17,594 |
| 2014 | $3,480 | $27,648 | $10,626 | $17,022 |
Source: Public Records
Map
Nearby Homes