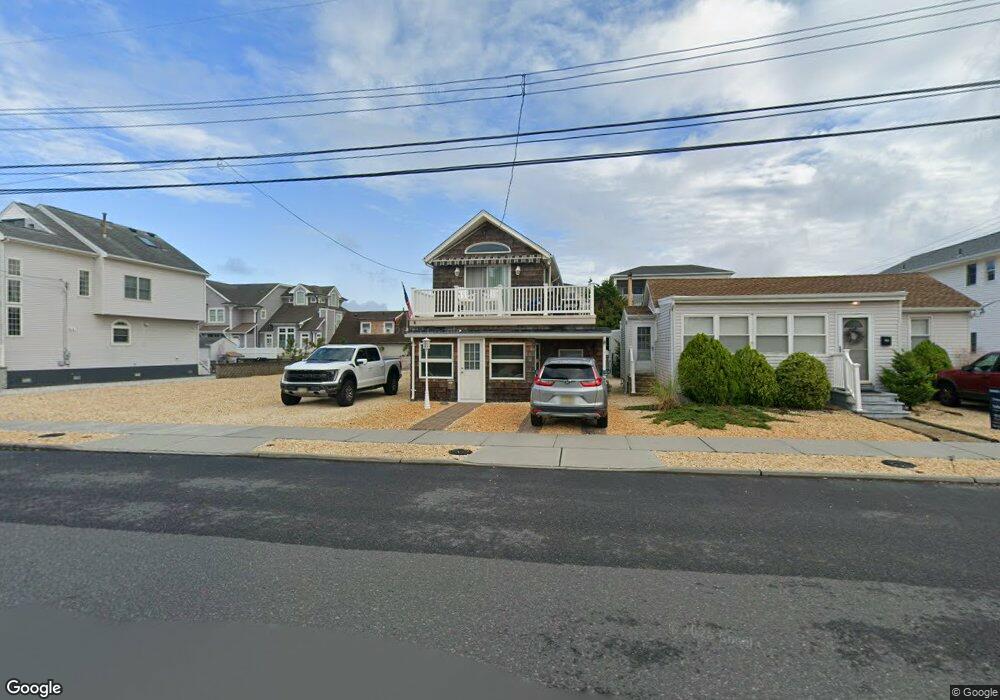
30 13th Ave Seaside Park, NJ 08752
Estimated Value: $740,000 - $955,000
3
Beds
2
Baths
1,595
Sq Ft
$552/Sq Ft
Est. Value
About This Home
This home is located at 30 13th Ave, Seaside Park, NJ 08752 and is currently estimated at $880,718, approximately $552 per square foot. 30 13th Ave is a home located in Ocean County with nearby schools including Central Regional Middle School and Central Regional High School.
Ownership History
Date
Name
Owned For
Owner Type
Purchase Details
Closed on
May 1, 2019
Sold by
Petranto Kimberly A
Bought by
Petranto Russell D
Current Estimated Value
Purchase Details
Closed on
Aug 3, 2010
Sold by
Mcdonald Joseph
Bought by
Mcdonald Joseph and Messer Alexander
Home Financials for this Owner
Home Financials are based on the most recent Mortgage that was taken out on this home.
Original Mortgage
$194,000
Interest Rate
4.55%
Mortgage Type
New Conventional
Purchase Details
Closed on
Dec 8, 2005
Sold by
Loundy Michael
Bought by
Porter Ave Llc
Purchase Details
Closed on
Aug 3, 2004
Sold by
Pietrowitz Thomas J
Bought by
Petranto Russell and Petranto Kimberly A
Home Financials for this Owner
Home Financials are based on the most recent Mortgage that was taken out on this home.
Original Mortgage
$320,000
Interest Rate
6.03%
Mortgage Type
Fannie Mae Freddie Mac
Create a Home Valuation Report for This Property
The Home Valuation Report is an in-depth analysis detailing your home's value as well as a comparison with similar homes in the area
Home Values in the Area
Average Home Value in this Area
Purchase History
| Date | Buyer | Sale Price | Title Company |
|---|---|---|---|
| Petranto Russell D | $260,000 | Multiple | |
| Mcdonald Joseph | -- | Madison Title Agency L L C | |
| Porter Ave Llc | -- | -- | |
| Porter Ave Llc | -- | -- | |
| Petranto Russell | $400,000 | Lawyers Title Insurance Corp |
Source: Public Records
Mortgage History
| Date | Status | Borrower | Loan Amount |
|---|---|---|---|
| Previous Owner | Mcdonald Joseph | $194,000 | |
| Previous Owner | Petranto Russell | $320,000 |
Source: Public Records
Tax History Compared to Growth
Tax History
| Year | Tax Paid | Tax Assessment Tax Assessment Total Assessment is a certain percentage of the fair market value that is determined by local assessors to be the total taxable value of land and additions on the property. | Land | Improvement |
|---|---|---|---|---|
| 2025 | $8,496 | $519,300 | $400,000 | $119,300 |
| 2024 | $8,356 | $519,300 | $400,000 | $119,300 |
| 2023 | $8,060 | $519,300 | $400,000 | $119,300 |
| 2022 | $8,060 | $519,300 | $400,000 | $119,300 |
| 2021 | $7,888 | $519,300 | $400,000 | $119,300 |
| 2020 | $7,805 | $519,300 | $400,000 | $119,300 |
| 2019 | $7,722 | $519,300 | $400,000 | $119,300 |
| 2018 | $7,218 | $519,300 | $400,000 | $119,300 |
| 2017 | $7,327 | $519,300 | $400,000 | $119,300 |
| 2016 | $6,813 | $519,300 | $400,000 | $119,300 |
| 2015 | $7,109 | $519,300 | $400,000 | $119,300 |
| 2014 | $6,792 | $519,300 | $400,000 | $119,300 |
Source: Public Records
Map
Nearby Homes
- 32 13th Ave Unit 34
- 26 13th Ave Unit 28
- 24 13th Ave
- 36 13th Ave
- 31 12th Ave
- 25 12th Ave Unit 27
- 22 13th Ave
- 35 12th Ave Unit Front & Rear
- 35 12th Ave
- 35 12th Ave Unit FRONT HOUSE
- 23 12th Ave
- 42 13th Ave
- 43 12th Ave Unit 45
- 41 12th Ave
- 16 13th Ave
- 27 13th Ave Unit 29
- 31 13th Ave
- 25 13th Ave
- 39 13th Ave Unit 41
- 44 13th Ave Unit 46