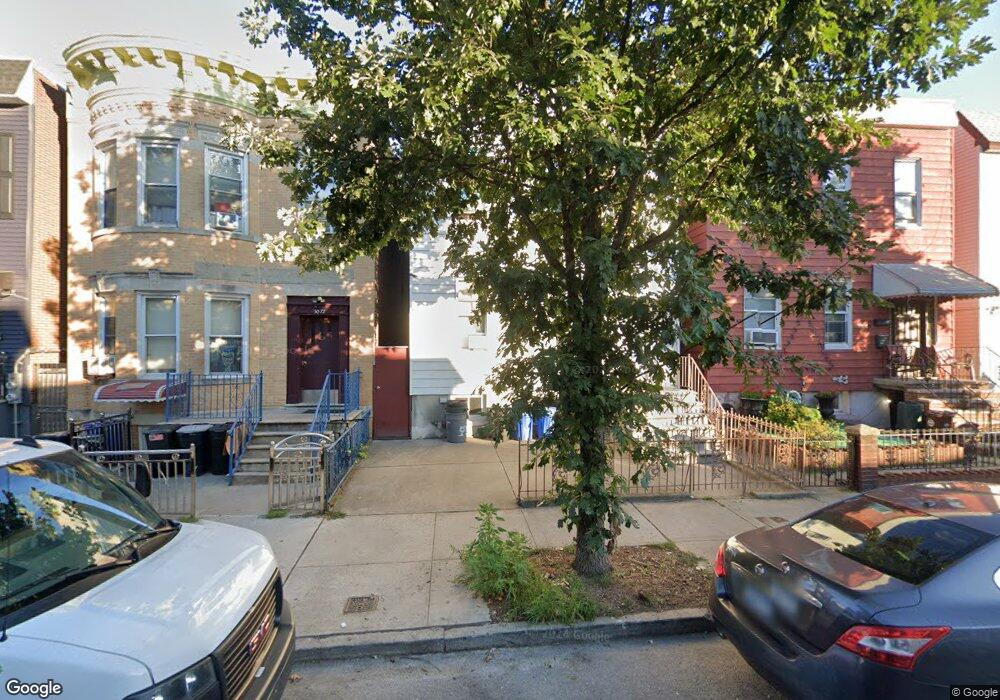
30-70 41st St Unit 64 Astoria, NY 11103
Astoria NeighborhoodEstimated Value: $1,279,000 - $1,446,000
7
Beds
3
Baths
2,200
Sq Ft
$611/Sq Ft
Est. Value
About This Home
This home is located at 30-70 41st St Unit 64, Astoria, NY 11103 and is currently estimated at $1,344,281, approximately $611 per square foot. 30-70 41st St Unit 64 is a home located in Queens County with nearby schools including I.S. 010 Horace Greeley, William Cullen Bryant High School, and Our World Neighborhood Charter School.
Ownership History
Date
Name
Owned For
Owner Type
Purchase Details
Closed on
Mar 23, 2023
Sold by
Lisa Nicole Mills Executor
Bought by
Cheung Ming Chiu
Current Estimated Value
Home Financials for this Owner
Home Financials are based on the most recent Mortgage that was taken out on this home.
Original Mortgage
$693,000
Outstanding Balance
$672,652
Interest Rate
6.5%
Mortgage Type
Purchase Money Mortgage
Estimated Equity
$671,629
Purchase Details
Closed on
Jul 28, 2010
Sold by
Curcuru Kathleen and Delgiorno Daniel
Bought by
Lanzone Leonard
Purchase Details
Closed on
Jan 6, 2009
Sold by
Delgiorno Stephen F
Bought by
Delgiorno Daniel and Delgiorno Kathleen
Purchase Details
Closed on
Dec 23, 2008
Sold by
Delgiorno Stephen F
Bought by
Delgiorno Stephen F
Purchase Details
Closed on
Jan 23, 1999
Sold by
Pascale Kathleen M and Pascale Theodore
Bought by
Curcuru Kathleen and Delgiorno Stephen
Create a Home Valuation Report for This Property
The Home Valuation Report is an in-depth analysis detailing your home's value as well as a comparison with similar homes in the area
Home Values in the Area
Average Home Value in this Area
Purchase History
| Date | Buyer | Sale Price | Title Company |
|---|---|---|---|
| Cheung Ming Chiu | $990,000 | -- | |
| Lanzone Leonard | $400,500 | -- | |
| Delgiorno Daniel | -- | -- | |
| Delgiorno Stephen F | -- | -- | |
| Curcuru Kathleen | -- | Fidelity National Title Ins |
Source: Public Records
Mortgage History
| Date | Status | Borrower | Loan Amount |
|---|---|---|---|
| Open | Cheung Ming Chiu | $693,000 |
Source: Public Records
Tax History Compared to Growth
Tax History
| Year | Tax Paid | Tax Assessment Tax Assessment Total Assessment is a certain percentage of the fair market value that is determined by local assessors to be the total taxable value of land and additions on the property. | Land | Improvement |
|---|---|---|---|---|
| 2025 | $8,117 | $42,816 | $10,069 | $32,747 |
| 2024 | $8,117 | $40,415 | $9,110 | $31,305 |
| 2023 | $7,404 | $38,263 | $8,216 | $30,047 |
| 2022 | $5,514 | $79,200 | $19,260 | $59,940 |
| 2021 | $7,659 | $80,220 | $19,260 | $60,960 |
| 2020 | $7,256 | $87,360 | $19,260 | $68,100 |
| 2019 | $6,752 | $96,240 | $19,260 | $76,980 |
| 2018 | $6,202 | $31,886 | $7,049 | $24,837 |
| 2017 | $6,200 | $31,886 | $9,665 | $22,221 |
| 2016 | $5,987 | $31,886 | $9,665 | $22,221 |
| 2015 | $3,408 | $29,733 | $12,243 | $17,490 |
| 2014 | $3,408 | $28,066 | $13,288 | $14,778 |
Source: Public Records
Map
Nearby Homes
- 30-77 42nd St
- 31-20 41st St
- 30-71 37th St
- 3702 31st Ave
- 43-12 30th Ave
- 43-14 30th Ave
- 3145 37th St Unit 3
- 31-61 43rd St
- 44-14 Newtown Rd Unit 3C
- 44-14 Newtown Rd Unit 1O
- 44-14 Newtown Rd Unit 5N
- 44-22 Newtown Rd
- 3080 47th St Unit 3A
- 3094 47th St
- 3218 42nd St
- 2590 37th St
- 31-42 34th St Unit MultiFamily
- 2569 38th St Unit 1R
- 25-64 38th St
- 25-63 38th St Unit 1A
- 30-70 41st St
- 3070 41st St
- 3068 41st St
- 3072 41st St
- 30-72 41st St
- 30-76 41st St
- 30-76 41st St Unit 2
- 3076 41st St
- 3066 41st St
- 3078 41st St
- 30-64 41st St Unit 3
- 30-64 41st St Unit 1
- 30-64 41st St
- 3064 41st St
- 3080 41st St
- 3069 Steinway St
- 3071 Steinway St
- 3067 Steinway St
- 3073 Steinway St
- 3084 41st St